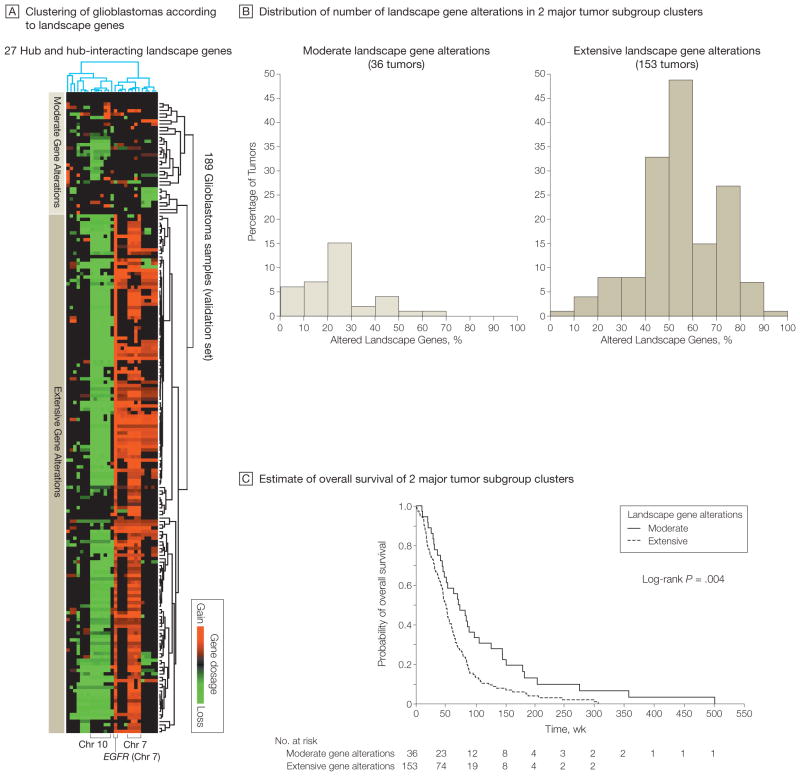
Figure 6.
Subgroups of Glioblastomas With Distinct Landscape Gene Profiles Associated With Patient Survival
A, Unsupervised hierarchical clustering (2-way complete linkage clustering based on Pearson correlation as the distance metric) of 189 of 219 glioblastomas from The Cancer Genome Atlas Pilot Project (TCGA) (with availability of corresponding survival data) according to the 27 landscape genes in Figure 5 with a TCGA-validated gene dosage–expression relationship. Rows on heat map represent patient samples; columns represent the 27 genes. Two major tumor clusters with distinct gene dosage alteration patterns were identified (moderate and extensive). Supervised group predictor analysis revealed highest group-predictive power for altered genes on chromosomes 7 and 10. B, Distribution of the number of landscape gene alterations among the 2 major clustering subgroups identified by the hierarchical clustering in panel A. The groups show a significant difference in mean number of landscape gene alterations (P<.001 by unpaired t test). C, Kaplan-Meier estimates of overall survival of the 2 major clustering subgroups indicated in panels A and B. Median follow-up was 73.1 (range, 10.6–503.4) weeks for the group with modest alterations and 47.0 (range, 1.1–307.4) weeks for the group with extensive alterations.

