
Figure 3.
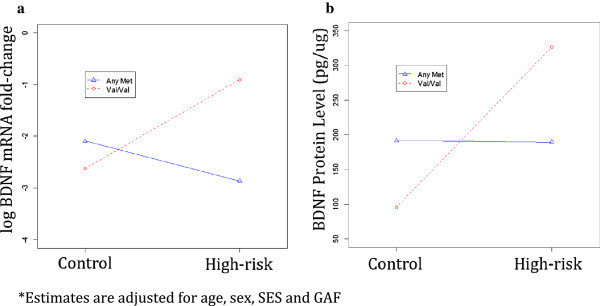
BDNF log mRNA expression (a) and protein levels (b) in high-risk and control offspring. MET genotype (blue lines) and VAL/VAL genotype (red lines)*.
Official websites use .gov
A
.gov website belongs to an official
government organization in the United States.
Secure .gov websites use HTTPS
A lock (
) or https:// means you've safely
connected to the .gov website. Share sensitive
information only on official, secure websites.
BDNF log mRNA expression (a) and protein levels (b) in high-risk and control offspring. MET genotype (blue lines) and VAL/VAL genotype (red lines)*.