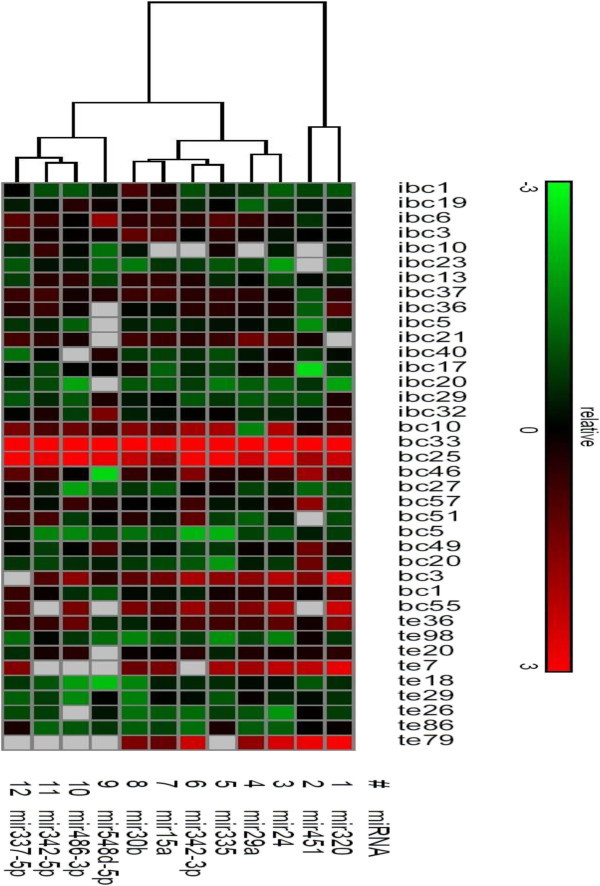
Figure 1.

Hierarchical clustering of miRNAs expression. miRNAs profiles of 17 IBC, 12 non-IBC and 9 healthy controls were clustered based on the 3 groups (IBC, non-IBC and healthy controls). Samples are in columns, miRNAs in rows. High expression values are indicated by bright red shades, low expression values are shown in green.
