
Figure 1.
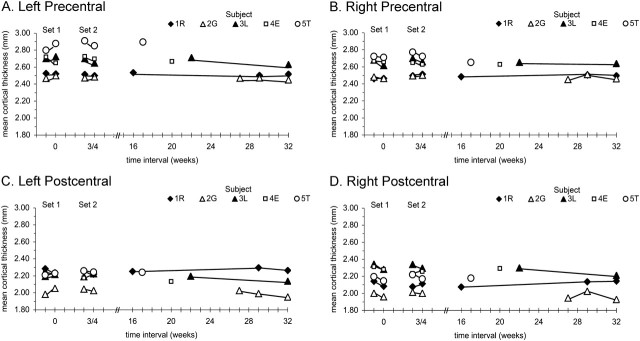
Measures of mean thicknesses of the left and right pre- and postcentral areas for all scans (n = 30) from each subject plotted as a function of the time between measures. In set 1 and set 2, pairs of test– retest measures were made in each individual within minutes of each other. Set 2 measures were made 3–4 weeks from set 1, and 1–3 further measures were made in each individual at intervals of 16–32 weeks.