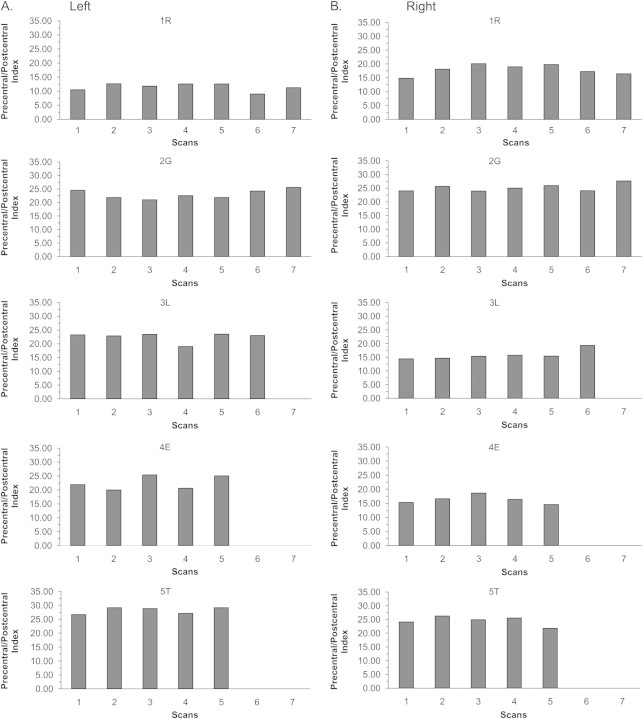
Figure 4.
Within-individual variation in “precentral/postcentral” indices that assessed the relationship of pre- and postcentral thicknesses in the same hemisphere. Scans 1 and 2 are from set 1, scans 3 and 4 are from set 2, and scans 5–7 are longer interval scans. In left (A) and right (B) hemispheres in each subject (1R–5T), the precentral area was thicker than the postcentral area and the disparity in thickness was individual specific and consistent over time.

