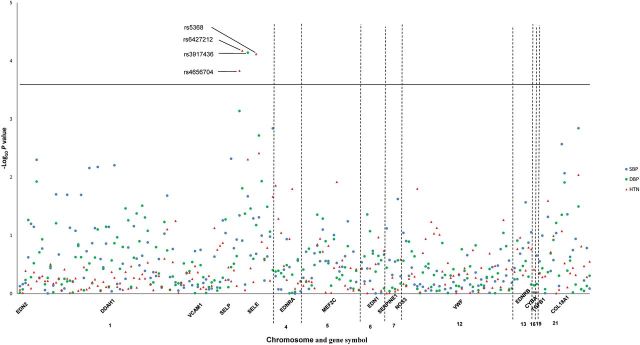
Figure 1.

Log10 P values for the 206 SNPs in 15 candidate genes of endothelial system with longitudinal changes in SBP, DBP, and hypertension incidence. The blue solid circle and green solid circle indicate P values for the interactions of follow-up time and genotype of each SNP for SBP and DBP, respectively. The red triangles indicate P values for the association of each SNP with hypertension incidence. All labeled SNPs are statistical significant after Bonferroni correction. Abbreviations: DBP, diastolic blood pressure; HTN, hypertension incidence; SBP, systolic blood pressure; SNP, single-nucleotide polymorphism.
