
Figure 1.
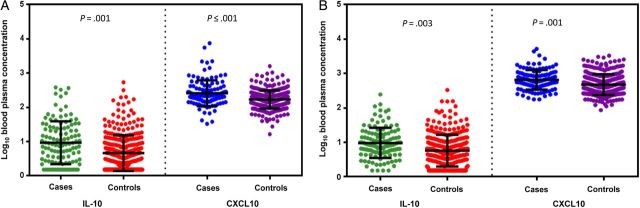
Mean log10 blood plasma concentrations for interleukin 10 (IL-10) and CXCL10 cytokines among cases and controls. The mean distribution of log10 concentration for IL-10 and CXCL10 for human immunodeficiency virus type 1 (HIV-1)–susceptible case and control partners (A) and HIV-1–infected case and control partners (B). Individual log10 cytokine concentrations plotted with mean (middle bar) and standard deviation (top and bottom bars).