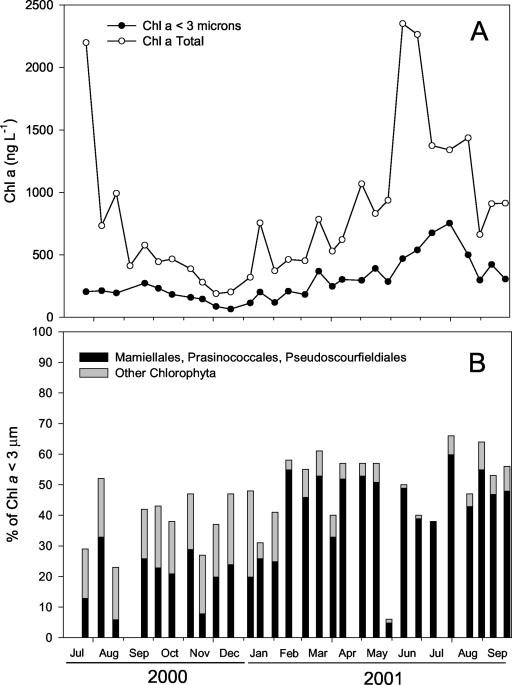
FIG. 3.
(A) Variations in Chl a biomass as measured by HPLC (total <200-μm and fraction <3-μm) at the ASTAN station. (B) Contributions of the division Chlorophyta and of the orders Mamiellales, Prasinococcales, and Pseudoscourfieldiales to the picoplankton fraction (<3-μm diameter) according to the CHEMTAX algorithm applied to HPLC data.

