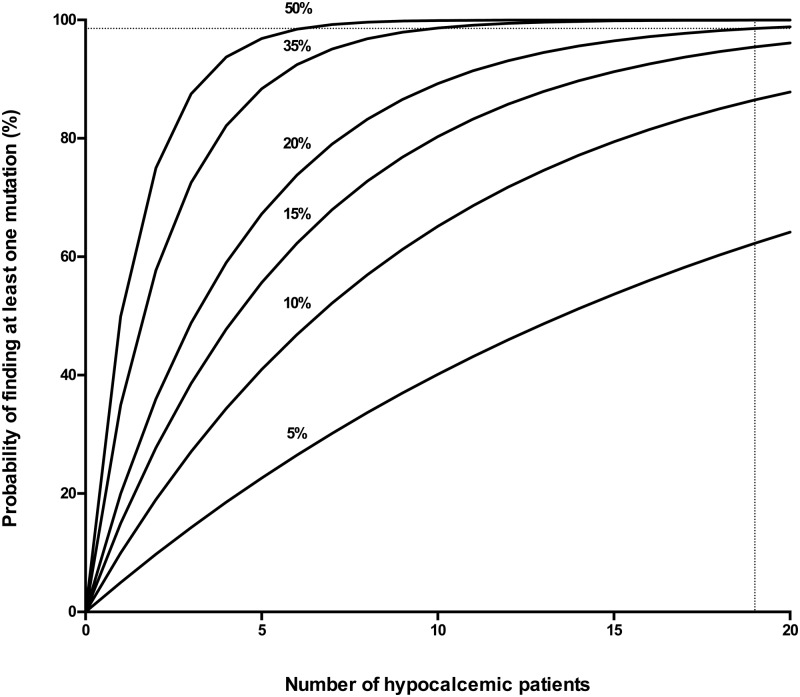
Figure 1.
Binomial probability analysis to predict the sample size required to detect one or more AP2S1 mutations for different mutation prevalences in hypocalcemic patients. The number of patients is shown on the x-axis, and the probability of detecting at least one AP2S1 mutation, at different prevalences ranging from 5% to 50%, is shown on the y-axis. The analysis indicated that a sample size of 19 hypocalcemic patients (represented by the dotted line) is required to detect at least one AP2S1 mutation at a 20% prevalence, which is observed in FHH3, with a probability of greater than 98%.

