
FIGURE 4.
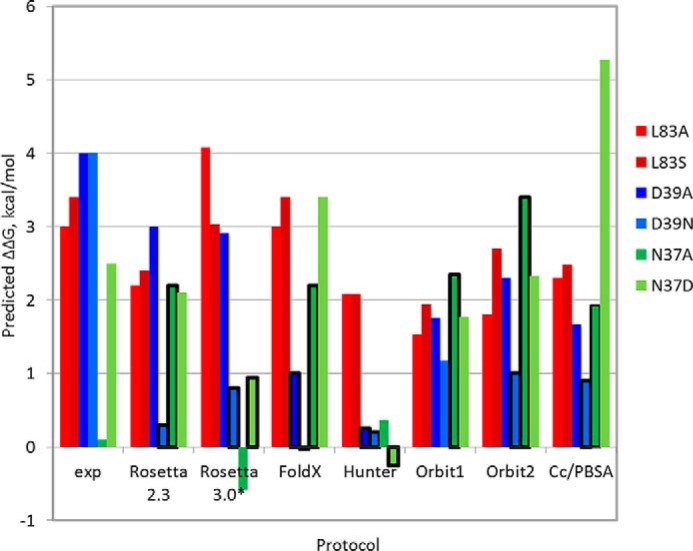
Comparison of predicted and experimental ΔΔG values indicates that none of a range of different computational approaches can accurately predict all tested mutations at C. thermocellum cohesin positions Leu83, Asn37, and Asp39. The plot shows experimental and predicted ΔΔG values (y axis) of the different mutations (colored red for Leu83, blue for Asp39, and green for Asn37). The x axis plots results from the experiment (exp) as well as from a range of different approaches, including different versions of Rosetta alanine scanning (Rosetta2.3 used in this study and a newly calibrated protocol Rosetta 3.0* (34)), FoldX (35), Hunter (37), two versions of the Orbit interface energy function EPPI-2 (36), and CC/PBSA (38). Incorrect predictions are boxed in bold black. All protocols accurately predict the effects of mutations of Leu83 but perform less well on polar mutations. See “Experimental Procedures” for more details about the different protocols.