
FIGURE 1.
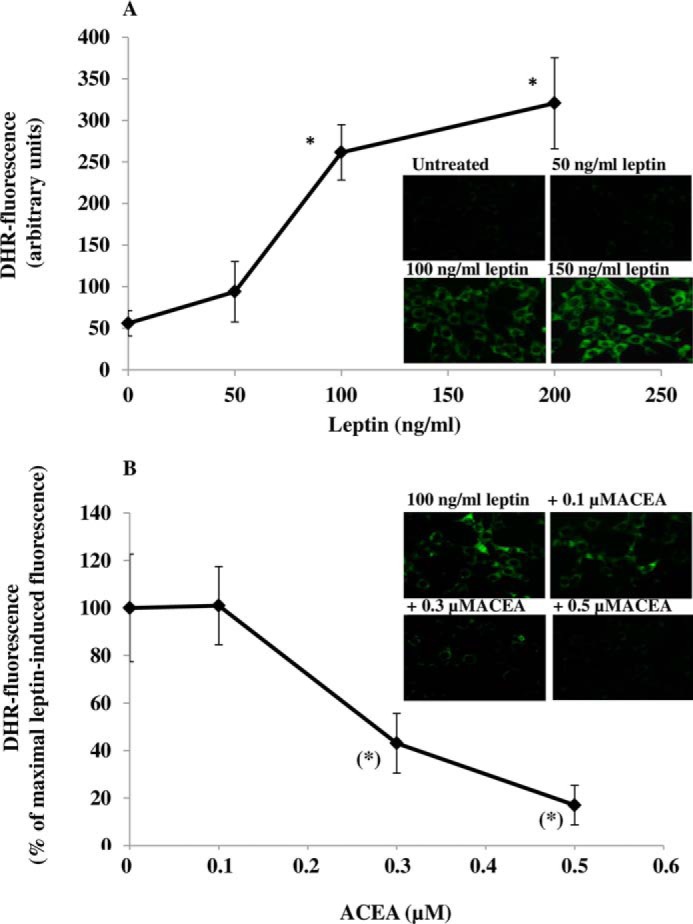
The CB1 receptor agonist ACEA prevents leptin-induced ROS formation in mHypoE-N41 cells. A, DHR-loaded cells were incubated for 4.5 h with increasing concentrations of leptin. After treatments, the cells were observed with a Leica DMI6000 fluorescence microscope equipped with a Leica DFC320 cooled digital CCD camera (Leica Microsystems). The resulting images were analyzed to quantify the mean fluorescence of individual cells using Metamorph Imaging Software (Leica MetaMorph AF). Representative micrographs of ROS accumulation in cells treated with different concentrations of leptin are also shown. Scale bar: 20 μm. Results are expressed as arbitrary units and represent the means ± S.E. calculated from three to five separate experiments, each performed in duplicate. B, the cells, loaded with DHR, were incubated for 30 min with increasing concentrations of ACEA and then treated for an additional 4.5 h with 100 ng/ml leptin. After treatments, the cells were analyzed with a fluorescence microscope as described above. Representative micrographs of the dose-dependent inhibition of ROS formation by ACEA in cells treated with leptin (100 ng/ml) are also shown. Results represent the mean ± S.E. of three separate experiments, each performed in duplicate. *, p < 0.01 compared with untreated cells; (*), p < 0.01 compared with leptin-treated cells (one-way ANOVA followed by Bonferroni's test).