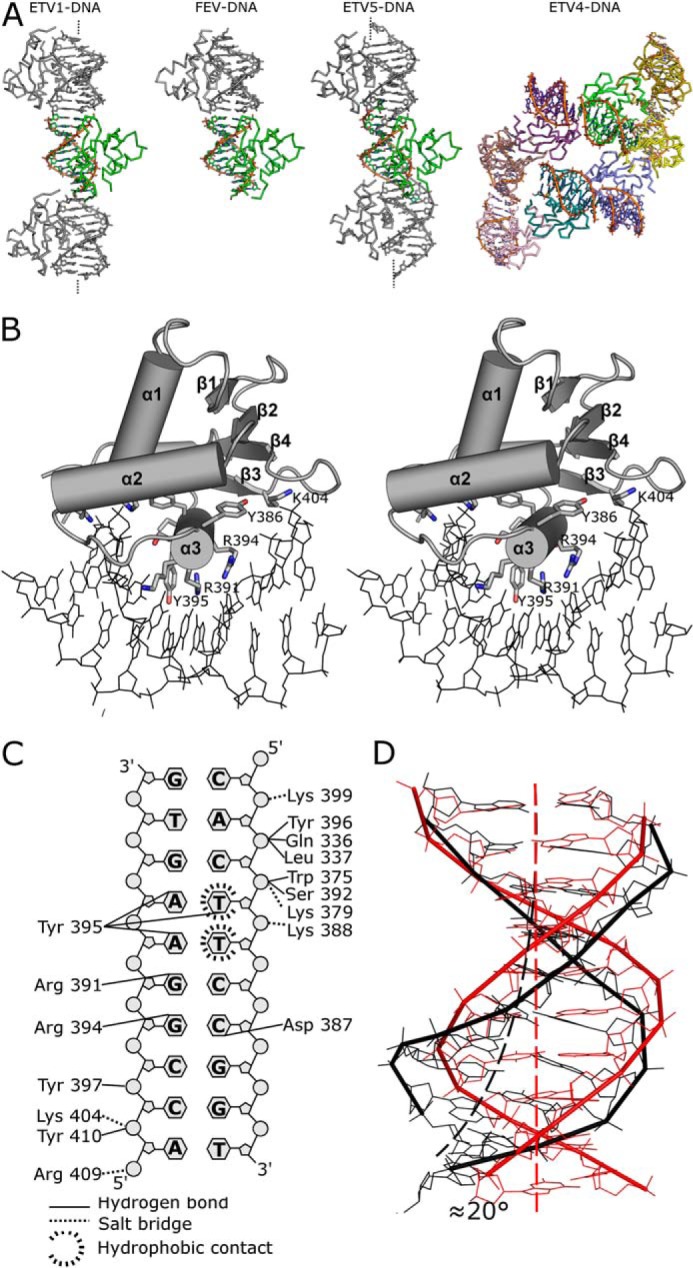
FIGURE 2.

Interactions of Etv1 with DNA. A, contacts formed by DNA complex crystals. The DNA molecules in the DNA complex crystals associate via blunt (Etv1 and Fev) or sticky ends (Etv4 and Etv5) with neighboring molecules in the crystal. The contents of the asymmetric unit are colored by chain with symmetry-related molecules colored gray. DNA fibers ending in dashed lines form a continuous helix running the entire length of the crystal. B, stereo view of the interaction between Etv1 and DNA. Etv1 is shown in cartoon representation with secondary structure elements labeled; residues forming close contacts with the DNA are shown as sticks, and the DNA is shown in the line representation. The DNA can be seen to undergo a significant widening of the major groove to accommodate extensive interactions with residues from the recognition helix α3. C, schematic view of the residues involved in the DNA protein interface of both Etv1 (shown on the left) and Fev (shown on the right). Hydrogen bonds are depicted as solid black lines, and salt bridges are represented as dashes. D, comparison of the DNA from the Etv1 DNA complex (black) with canonical B form DNA of similar length (red). The DNA can be seen to undergo a significant widening of the major groove and bending of ∼20° toward the protein interface.
