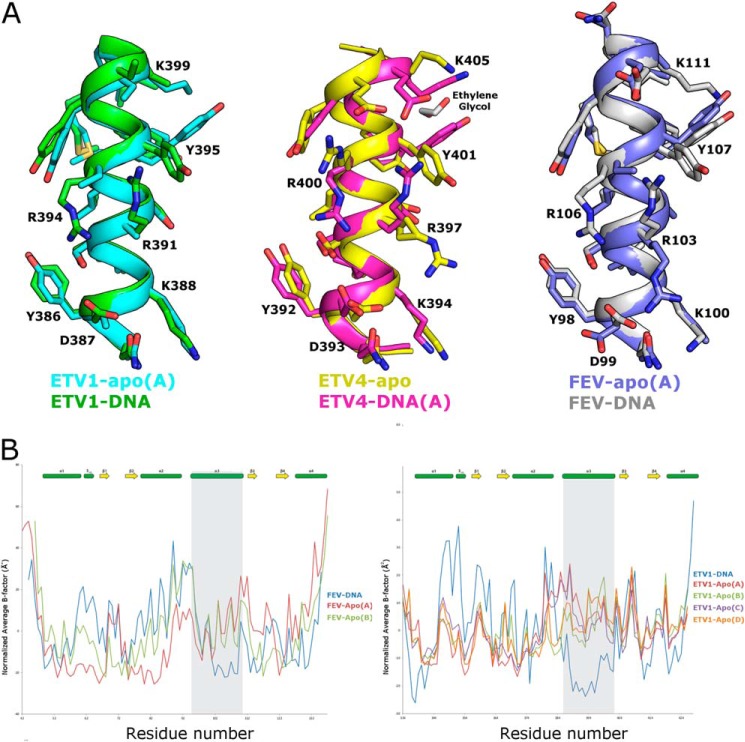
FIGURE 5.
Structural transitions on DNA binding in Fev and Etv1. A, comparison of the apo- and DNA-bound forms of Etv1 (shown on the left), Etv4 (center), and Fev (shown on the right) reveals significant disorder-order transitions and rotamer movements within the recognition helix that accompany DNA binding. B, comparison of temperature factors of apo- and DNA-bound forms. The average B-factor (normalized so that the mean value is equal to zero) is plotted as a function of residue number for Fev (left panel) and Etv1 (right panel), with secondary structural elements shown for reference. Residues belonging to the recognition helix α3 are highlighted by a gray background and can be seen in both cases to transition from relatively high B-factors to among the lowest B-factors in the entire structure. These transitions, however, were not seen in a comparison of Etv4 apo- and DNA-bound crystals, probably due to the extensive crystal contacts formed by residues in this helix in the apo-crystals, which consequently diffract to 1.05 Å resolution.

