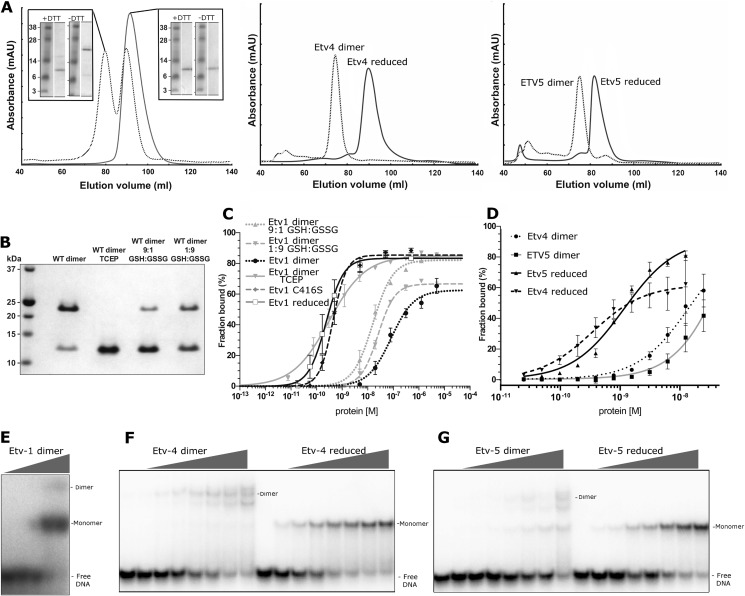
FIGURE 9.
Redox-dependent regulation of Etv1, Etv4, and Etv5. A, purification of Etv1 (left panel), Etv4 (center panel), and Etv5 (right panel) under reducing (solid lines) or nonreducing conditions (dashed lines). The inset in the left-hand panel shows the SDS-PAGE analysis of the size exclusion fractions denatured in the presence (upper right) or absence (lower right) of 5 mm DTT. B, nonreducing SDS-PAGE of an SEC fraction of Etv1 eluting as a dimer (WT dimer) or treated prior to gel loading under various reducing conditions: 10 mm TCEP, and different ratios of reduced (GSH) and oxidized (GSSG) glutathione. C, DNA binding isotherms of different oligomeric/redox states of Etv1 from EMSA analysis. The proteins used were as follows: Etv1 purified under reducing conditions (monomeric); Etv1-C416S mutant (monomeric); Etv1 dimer purified under oxidizing conditions; Etv1 dimer treated with 10 mm TCEP; Etv1 dimer treated with reduced glutathione: and Etv1 dimer treated with oxidized glutathione. D, DNA binding isotherms of Etv4 and Etv5 from EMSA analysis. The proteins used were as follows: Etv4 purified under oxidized conditions (dimeric); Etv5 purified under oxidized conditions (dimeric); Etv4 dimer treated with 10 mm TCEP; and Etv5 dimer treated with 10 mm TCEP. DNA probe concentration was 0.2 nm. Error bars are plotted as ± S.E. E, EMSA of dimeric Etv1 showing a slower mobility Etv1-DNA species that is presumed to represent the dimeric species. F, EMSA of dimeric and reduced Etv5 showing bands representing monomeric and dimeric DNA complexes. G, EMSA of dimeric and reduced Etv5 showing bands representing monomeric and dimeric DNA complexes.

