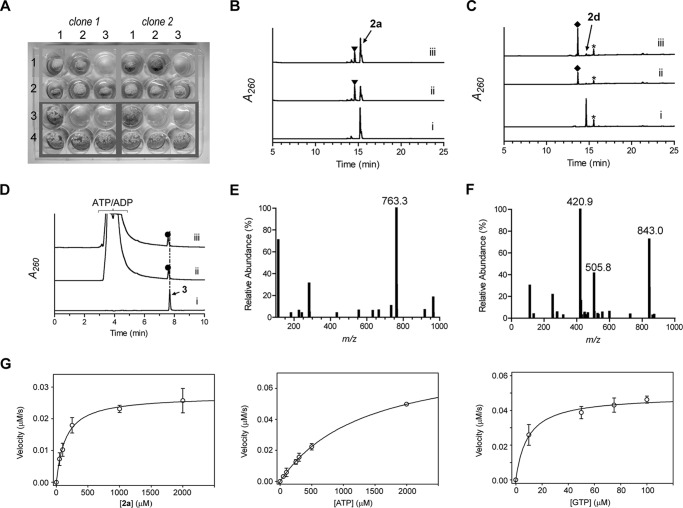
FIGURE 7.
Characterization of the phosphotransferase Cpr17. A, resistance to 1a conferred to S. albus upon heterologous expression of cpr17 using variable amounts of 1a (0 μg/ml (column 1), 100 μg/ml (column 2), and 500 μg/ml (column 3)). The top two rows (pWHM3 (row 1) and pWHM3-ermEp-cpr17 (row 2)) consist of mycelia diluted 1:10 following homogenization of a liquid culture of S. albus, whereas the bottom two rows (pWHM3 (row 3) and pWHM3-ermEp-cpr17 (row 4)) consist of mycelia diluted 1:100 prior to spotting on ISP2 agar plates. B–D, HPLC traces with the indicated substrate incubated without enzyme (i), with Cpr17 (ii), and with CapP (iii). ▾, 3″-phospho-2a; ♦, 3″-phospho-2d; ●, 3″-phospho-3. A260, absorbance at 260 nm. *, unidentified contamination peak. E, mass spectrum of the peak at retention time 7.7 min (D, trace i) corresponding to authentic 3. F, representative mass spectrum of the peak at retention time 7.6 min (D, trace ii or iii) corresponding to 3″-phospho-3. All mass data are reported in negative ion mode. G, plots for single-substrate kinetic analysis of Cpr17.

