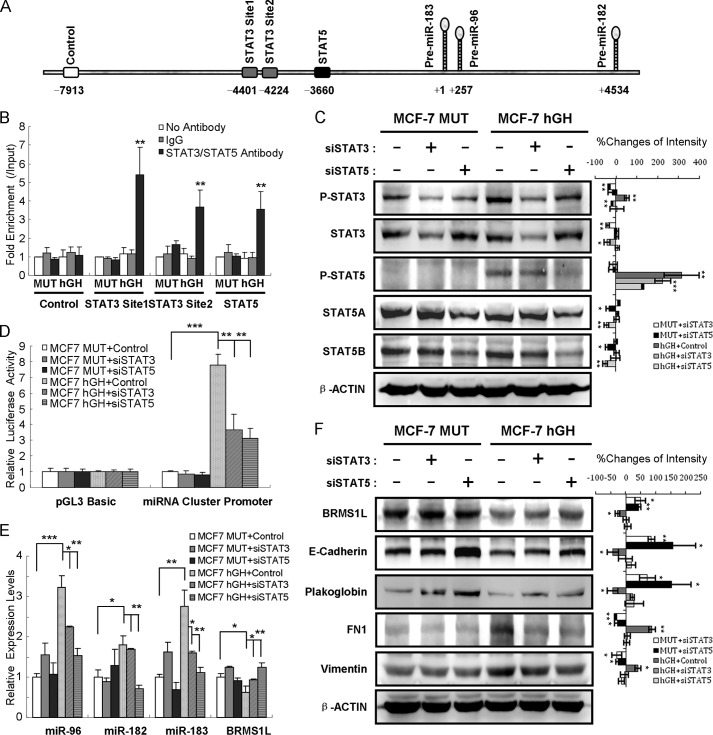
FIGURE 8.
Autocrine hGH stimulates miR-96-182-183 cluster expression via STAT3 and STAT5. A, bioinformatic analysis predicted two STAT3 motifs (gray box) and one STAT5 (black box) motif in the 5-kb regulatory region upstream of miR-96-182-183 precursor. The numbers indicate distance relative to the transcription start site (+1). The white box represents negative control sequence for the ChIP assay. B, ChIP assay by qRT-PCR in MCF-7-MUT and MCF-7-hGH cells. C, the expression of phospho-STAT3, total STAT3, phospho-STAT5, STAT5A, and STAT5B was detected by Western blot. β-ACTIN served as input control (left). Changes of band intensity relative to β-ACTIN intensity (right) are shown. D, luciferase assays for promoter activity in MCF-7-MUT and MCF-7-hGH cells transfected with STAT3 or STAT5 siRNA. E, qRT-PCR analysis of miR-96-182-183 and BRMS1L expression after STAT3 or STAT5 siRNA transfection in MCF-7-MUT or MCF-7-hGH cells. F, STAT3 or STAT5 siRNA abrogated autocrine hGH-mediated EMT change (left). Changes of band intensity relative to β-ACTIN intensity (right) are shown. *, p < 0.05; **, p < 0.01; ***, p < 0.001 (Student's t test). Error bars, S.E.

