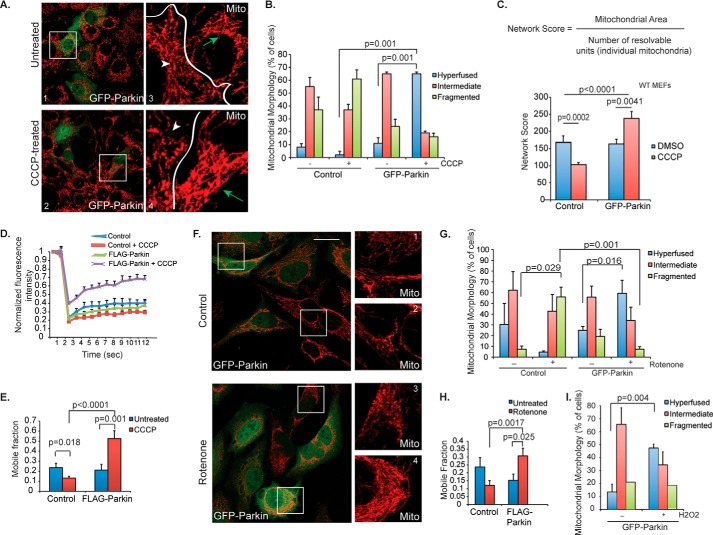
FIGURE 1.
Mitochondrial morphology in response to CCCP treatment. A, control (top) or 1 μm CCCP-treated (bottom) WT MEFs were transiently transfected with GFP-parkin (green), and mitochondria were immunostained using cytochrome c (red) antibody. Scale bar represents 25 μm. Small squares represent ×4 zoom images of cytochrome c staining (red only). Arrows (green) mark transfected cells and arrowheads (white) are cells not expressing GFP-parkin (untransfected). B, mitochondrial morphology was assessed in WT MEFs, and the percentage of cells (average ± S.D.) with hyperfused (blue bars), intermediate (red bars) or fragmented (green bars) was plotted. Cells were either control (−) or treated (+) with 1 μm CCCP for 18 h, as indicated. C, mitochondrial morphology was analyzed quantitatively using image analysis and Metamorph software to derive the network score, or the ratio of mitochondrial area to number of individual mitochondria (“resolvable units”). For a more complete description, see “Experimental Procedures.” The network score was measured for WT MEFs expressing GFP-parkin (versus control cells) with (red bars) or without (blue bars) treatment with CCCP (1 μm, 18 h). The average score ± S.D. is plotted. D, connectivity of mitochondria in WT MEFs was quantitatively assessed using FRAP. Cells were transfected with YFP targeted to the mitochondrial matrix (mito-YFP) and either control vector or parkin (FLAG-tagged) with or without treatment with 1 μm CCCP. Mito-YFP recovery is plotted, with greater increases in normalized fluorescence intensity (y axis) over time in seconds (x axis) representing more interconnected mitochondria. Data represent mean ± S.E. (n ∼ 20 cells per condition). E, the average mobile fraction (± S.E.) of the mito-YFP from the FRAP experiment in C is plotted, with larger mobile fractions representing more interconnected mitochondria. F, HeLa cells were transiently transfected with GFP-parkin (green) and imaged as in A. Boxes 1 and 4 are transfected cells, boxes 2 and 3 are untransfected cells. G, mitochondrial morphology was assessed in HeLa cells treated with DMSO control or 50 nm rotenone for 2 h, and the data were plotted as in B. H, FRAP was performed in HeLa cells treated with rotenone (100 nm, 2 h) or control (DMSO), and the average mobile fraction was plotted as in D. I, HeLa cells transiently transfected with GFP-parkin were treated with control or H2O2 (100 nm, 2 h), and mitochondrial morphology was assessed as in B. All statistical significance was assessed using two-way ANOVA analysis with Tukey's test.

