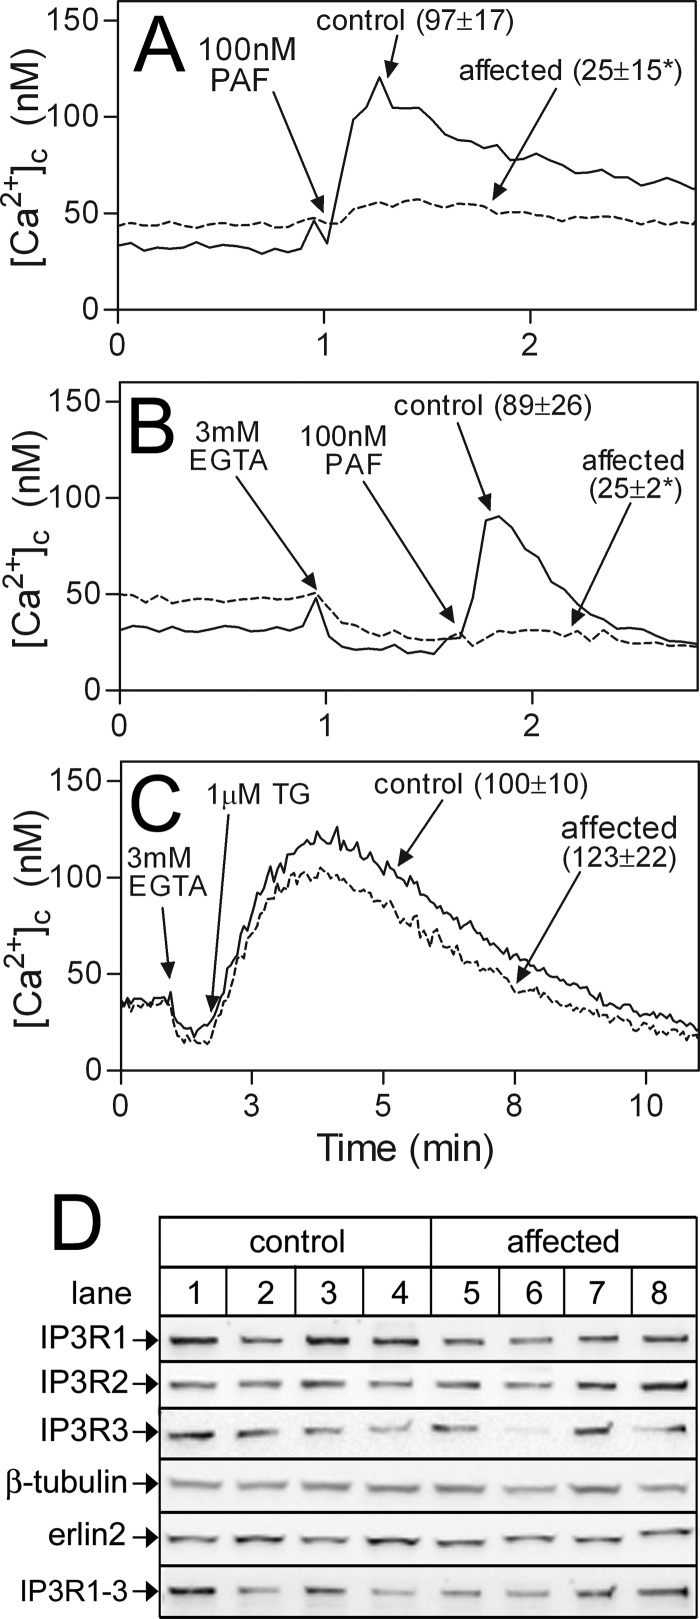
FIGURE 6.
Assessment of the IP3-medited Ca2+ signaling pathway in lymphoblasts. Multiple control and affected lymphoblast cell lines (n) were analyzed. A–C, fura2-loaded cells were exposed to PAF, EGTA, and thapsigargin (TG) as indicated and [Ca2+]c was calculated. Values in parentheses are mean ± S.E. of PAF- or TG-induced increases in [Ca2+]c over basal values (n ≥ 4, with * indicating p < 0.05 when comparing values from control versus affected cells). D, lysates from 4 control and 4 affected lymphoblast lines were probed for the proteins indicated. Total IP3R immunoreactivity in control and affected lymphoblasts, measured with anti-IP3R1–3 (lowest panel), was 80 ± 20 and 76 ± 15 arbitrary units, respectively (mean ± S.E.).

