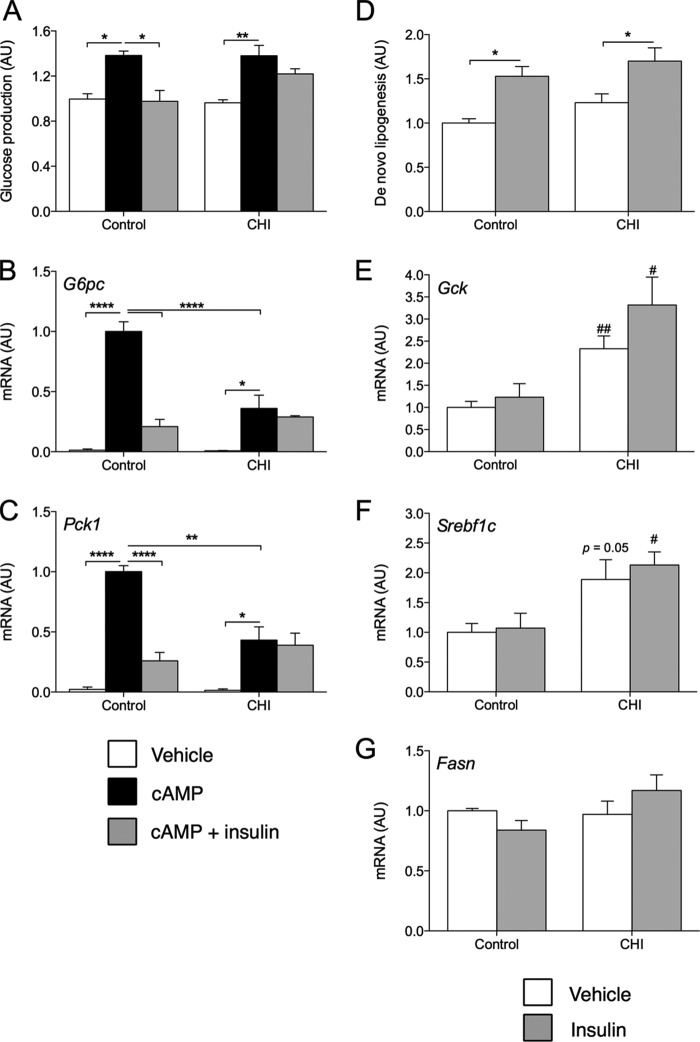
FIGURE 2.
Metabolic effects of chronic insulin treatment. A–C, relative glucose production (A) and gene expression (B and C) in control or CHI-treated primary hepatocytes incubated for 5 h with vehicle, cAMP, or cAMP and insulin. Data are normalized to vehicle-treated control. AU, arbitrary units. D–G, relative de novo lipogenesis (D) and gene expression (E–G) in control or CHI-treated primary hepatocytes incubated for 5 h with vehicle or 10 nm insulin. Data are normalized to vehicle-treated control and represent mean ± S.E. of at least three independent experiments performed in triplicate. *, p < 0.05, **, p < 0.01, ****, p < 0.0001 by Tukey's post hoc analysis following two-way analysis of variance. #, p < 0.05, ##, p < 0.01 relative to control by two-tailed, unpaired Student's t test.

