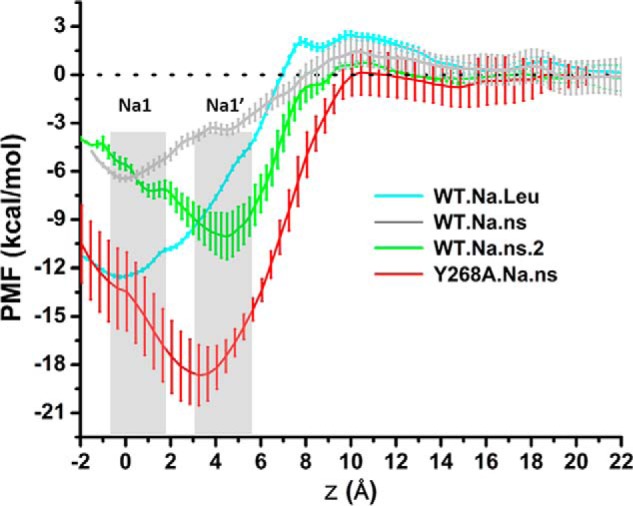
FIGURE 3.

The Na1′ is a stable Na+ binding site in the simulated Y268A.Na.ns condition. PMF computations for a cation positioned along the membrane normal (z) indicate the relative energetics of binding in the Na1 site (at z = ∼0 Å) versus in the Na1′ site (at z = ∼4 Å). PMF profiles are colored differently for different trajectories, as indicated. Each PMF was started from a representative snapshot (see “Experimental Procedures”) with minimum average root mean square deviation from any other conformation in the equilibrated stages of a trajectory. The bars represent the error estimated from seven blocks in block-averaging of data from independent PMF computations. Error analysis was performed with a Monte Carlo routine with bootstrapping. Note that the PMF results for WT.Na.Leu and WT.Na.ns are from Ref. 14.
