
FIGURE 4.
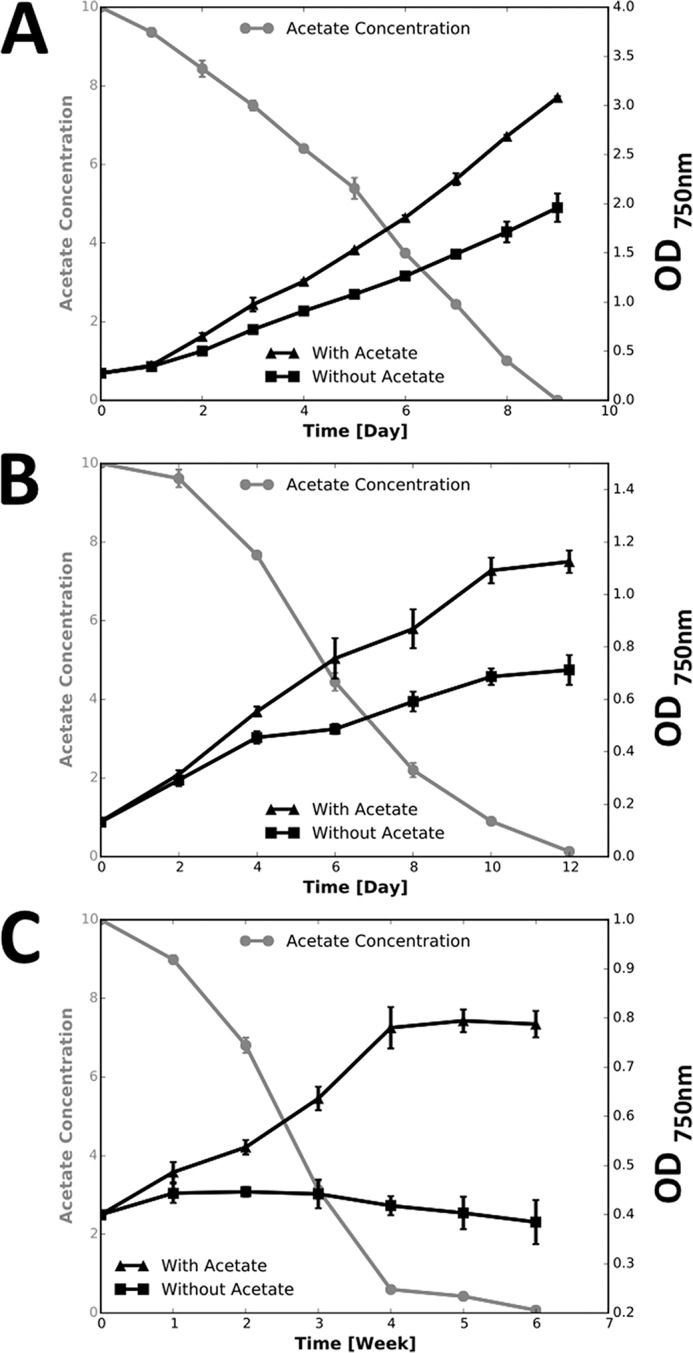
Acetate assimilation and growth curves for C. fritschii PCC 9212. Black lines indicate the cell density and gray lines indicate the acetate concentrations in the medium at different times during the batch growth cycle. A, C. fritschii PCC 9212 growing under standard conditions. B, C. fritschii PCC 9212 growing under low CO2 conditions (cultures were sparged with air). C, C. fritschii PCC 9212 grown under dark conditions (1% CO2 in air). The data shown are averages of three biological replicates, and the error bars show the standard deviation. Other details concerning the growth conditions are described under ”Experimental Procedures.“