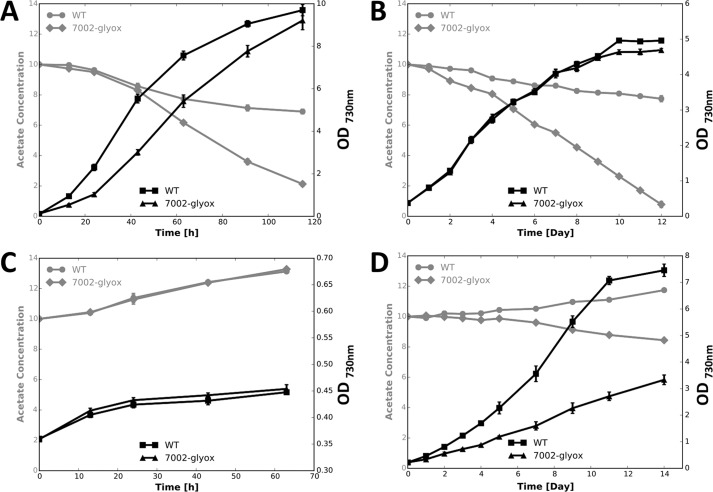
FIGURE 6.
Acetate assimilation and growth analysis of Synechococcus sp. PCC 7002. Black lines indicate cell density and gray lines indicate the acetate concentrations in the medium at different growth stages. A, Synechococcus sp. PCC 7002 grown under standard conditions; B, Synechococcus sp. PCC 7002 growing under low light conditions; C, Synechococcus sp. PCC 7002 growing under dark conditions; D, Synechococcus sp. PCC 7002 growing under low CO2 conditions. WT, wild type Synechococcus sp. PCC 7002; 7002-glyox, Synechococcus sp. PCC 7002 strain with aceBA genes of C. fritschii PCC 9212 expressed from pAQ1. The data shown are averages of three biological replicates, and the error bars show the S.D.

