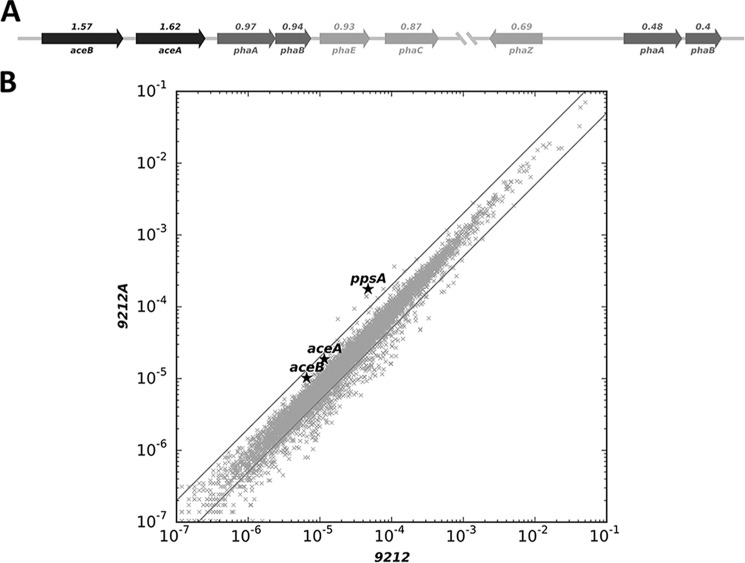
FIGURE 7.
Relative transcript abundances for mRNAs in C. fritschii PCC 9212 grown with or without acetate. A, gene neighborhood around the glyoxylate cycle genes. Numbers above each gene indicate the fold-difference of mRNA abundance in cells grown with acetate compared with cells grown without acetate. B, scatter plot showing the relative abundance of all the mRNAs under growth conditions without acetate (9212) or with acetate (9212A). Gray lines indicate a 2-fold increase or 50% decrease in mRNA level. aceA, isocitrate lyase; aceB, malate synthase; phaA, acetyl-CoA acetyltransferase; phaB, acetoacetyl-CoA reductase; phaE, poly(R)-hydroxyalkanoic acid synthase, class III, PhaE subunit; phaC, poly(R)-hydroxyalkanoic acid synthase, class III, PhaC subunit; phaZ, poly(3-hydroxybutyrate) depolymerase; ppsA, phosphoenolpyruvate synthase.

