FIGURE 3.
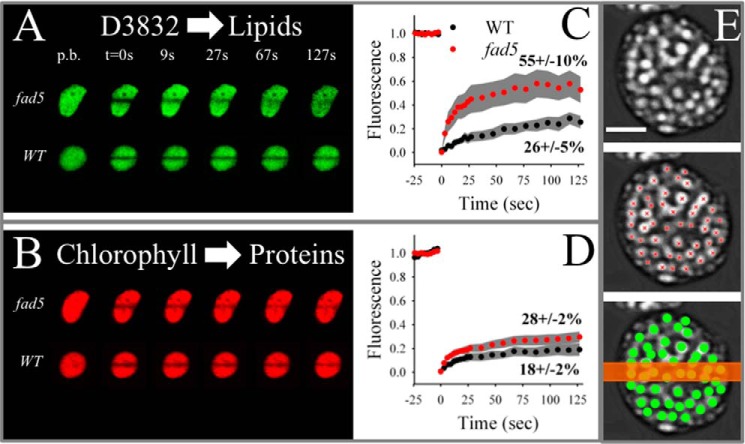
FRAP analysis on isolated thylakoid membranes shows higher diffusion of photosynthetic components in the fad5 mutant. A and B, examples for D3832 (A) and Chl fluorescence (B) time series. The line bleach was induced at time point 0 (t = 0 s) p.b., pre-bleach images. D3832 signal is a measure for lipid diffusion. Note the faster recovery of D3832 fluorescence in the fad5 mutant. Chl fluorescence measures mainly LHCII and PSII mobility. C, statistical analysis of the FRAP data for D3832. Pigments were bleached at time point 0 (corresponds to t = 0 s in Fig. 2A). Data represents the mean of 12 (WT) and 21 (fad5) measurements with 95% confidence interval given as gray areas. The percent values give the mobile fraction that recover in the course of the experiment. D, same analysis as in C but for the chlorophyll fluorescence. E, schematics demonstrating the relation between the width of the bleach stripe (typically 700 nm, orange bar) and the density and sizes of grana discs (green circles) in the FRAP experiment shown in A and B. The gray images are trimmed CLSM images showing grana thylakoids as bright spots (modified from Ref. 75). Red crosses indicate the centers of individual grana piles. Scale bar, 2 μm.

