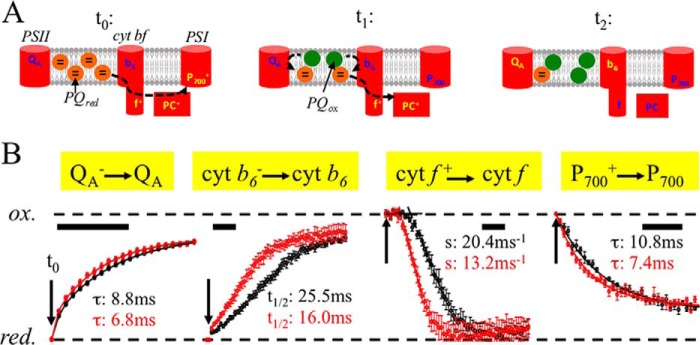
FIGURE 4.

Redox kinetics of PQ reaction partners reveals faster inter-photosystem ET in the fad5 mutant. Freshly isolated chloroplasts were osmotically shocked directly before the measurements leading to highly active thylakoid membranes (linear electron transport rate H2O to MV is 290 μmol O2 (mg of Chl)−1 h−1). Redox changes were induced by a 200-ms saturating light pulse and dark relaxation kinetics measured by difference absorption (cyt f, b6, and P700) or chlorophyll fluorescence (QA) spectroscopy. Conditions are as follows: 100 μm Chl in measuring buffer (pH 8.0), 100 μm MV, 2 μm nigericin, 2 μm valinomycin, and 5 mm sodium ascorbate. A, schematics showing the redox status of the electron transport components at different time points after switching off (t0) the 200-ms saturating light pulse. Note that the first electrons from PQH2 reduce first P700+ (t1). B, normalized redox kinetics; t0 indicates the time point when the light pulse is switched off. Scale bars indicate 10 ms. The data represent four averages collected with three independent biological samples for each genotype. Red circles, fad5 mutant; black circles, WT. Data fitting with exponentials gives time constants (τ) for the QA− re-oxidation. The fitting requires three exponentials. The given time constants are for the dominating (67% amplitude) middle phase that reflects PQ-dependent re-oxidation. P700+ re-reduction kinetics were fitted with two exponentials. The τ values of the main components (74%) are shown in panel B. It was not possible to fit the complex cyt b6− kinetics with exponentials. Therefore, half-times (t½) were deduced. Cyt b6− re-oxidation requires oxidized PQ at the Qr side that is provided by PQH2 turnover at the Qo side and diffusion to the Qr side. For cyt f+ kinetics, regression lines were derived from the point of inflections and extrapolated to 100% reduction that gives the lag times. The lag times for fad5 are 6.2 ms and for WT 10.4 ms. Furthermore, the slopes (s) of the regression lines are indicated. Both the lag phase and the slope of cyt f+ re-reduction depend on diffusion and binding of several PQH2 to the Qo side. The ratios of fad5 to WT for the rates (reciprocal τ and t½) are 1.29 (QA−), 1.46 (P700+), 1.59 (cyt b6−), 1.68 (lag cyt f+), and 1.55 (slope cyt f+). Thus, all PQ-dependent ET reactions are significantly accelerated in fad5. Data represent the mean ± S.D. of 4–6 measurements.
