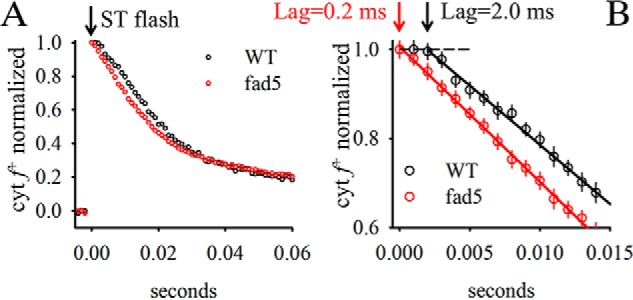
FIGURE 5.

A, re-reduction kinetics of cyt f+ after single turnover excitation. Same measuring conditions as for Fig. 4. The full width of half-maximum of the flash was 5 μs. B, zoom-in to the time region directly after flash application. Arrows indicate the lag phase derived by extrapolating the reduction kinetics to the complete oxidation level (dashed line). Data represent the mean ± S.D. of 10 measurements. Note the difference in lag phase between mutant and WT.
