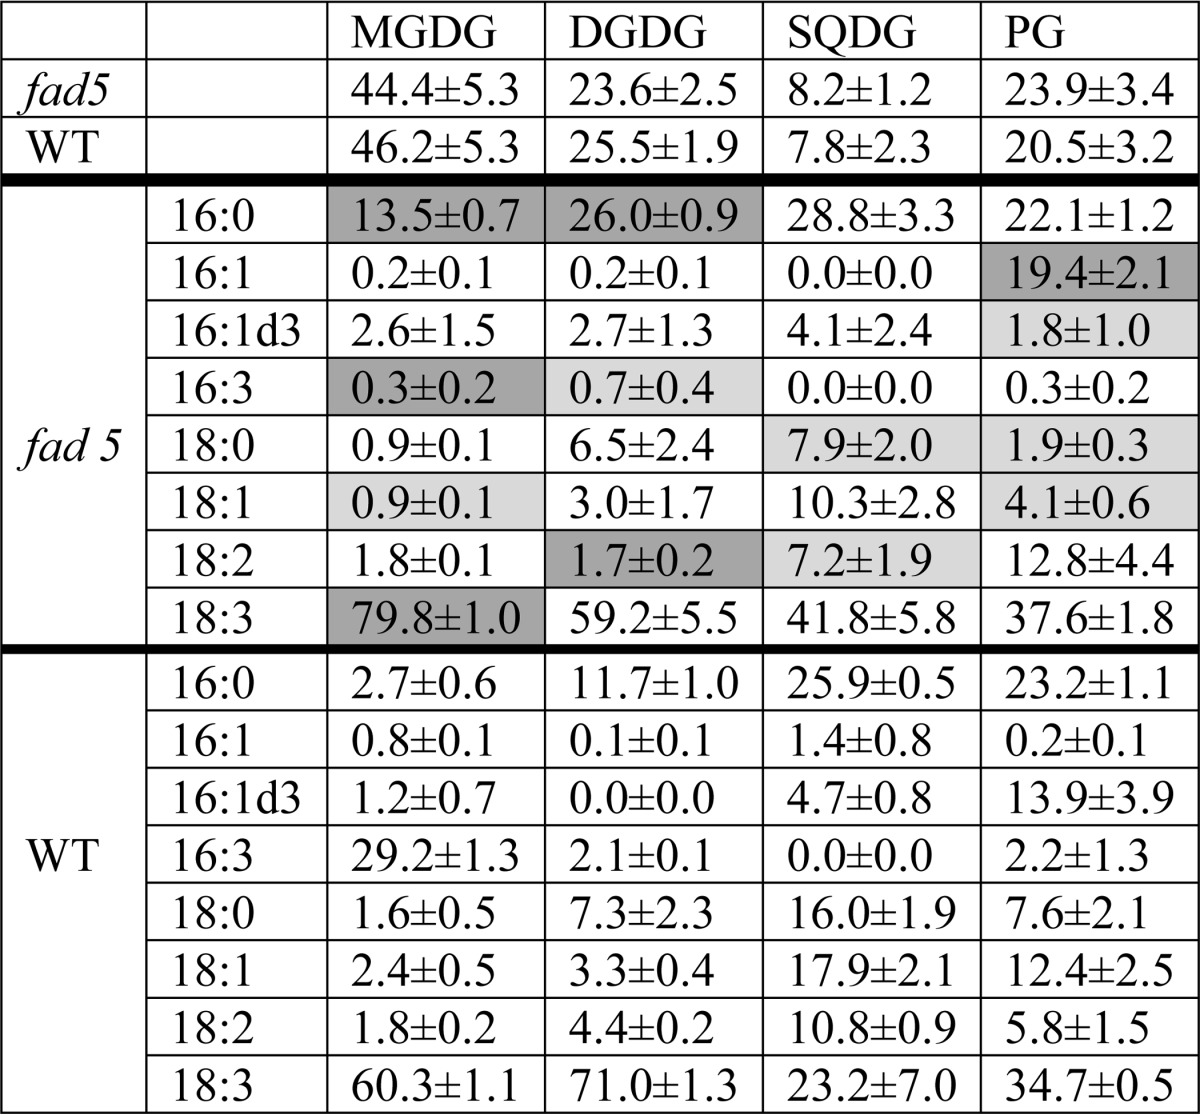
TABLE 1.
Lipid and fatty acid composition of WT and fad5 thylakoid membranes
All numbers are in %. Values for lipid class quantification (2nd and 3rd rows) are the means ± S.E. of 10–14 determinations. The fatty acid pattern is the means ± S.E. of four independent measurements. Significant changes (p < 0.05) of fad5 relative to WT are highlighted in light gray and highly significant changes (p < 0.001) in gray.

