
FIGURE 2.
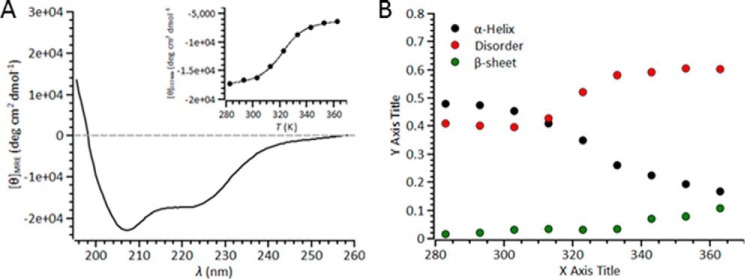
CD spectrum showing that NEMO has a large percentage of disordered structure content. A, far-UV CD spectra of NEMO. The data shown are the raw averaged data from 10 spectra, with the corresponding buffer spectra subtracted. The inset shows the temperature dependence of the signal at 222 nm, fit to Equation 1. B, results of fitting far-UV CD data (contin set 7). The variation in turn content is not shown for clarity. Conditions were 20 mm Tris-SO4 (pH 8), 50 mm NaCl, 2 mm β-mercaptoethanol, and 6 μm NEMO. MRE, mean residue ellipticity; deg, degrees.