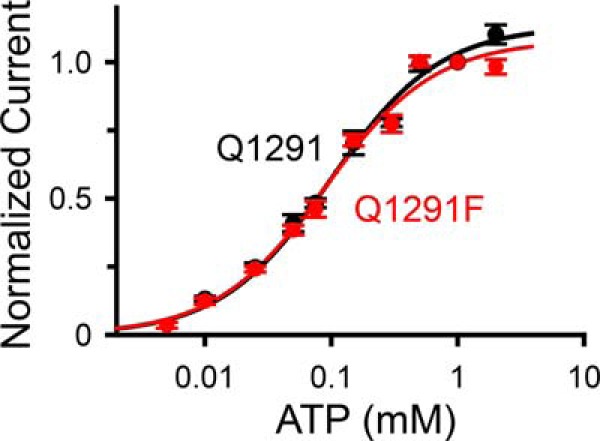
FIGURE 4.

Effect of ATP concentration on current of wild-type (Q1291; black) and Q1291F CFTR (red). Experiments were performed as shown in Fig. 3A. Data are from two wild-type and 15 Q1291F CFTR patches with n ≥ 8 for each ATP concentration. Because each patch contained a different number of CFTR channels, all current measurements were normalized to the current obtained with 1 mm ATP in the same patch. Lines are fits to a Michaelis-Menten equation using apparent Km values of 98 ± 7 μm (wild type; black line) and 89 ± 6 μm (Q1291F mutant; red line) and maximum normalized current values at high ATP concentrations of 1.13 ± 0.02 (wild type; black line) and 1.08 ± 0.02 (Q1291F mutant; red line). Error bars, S.E.
