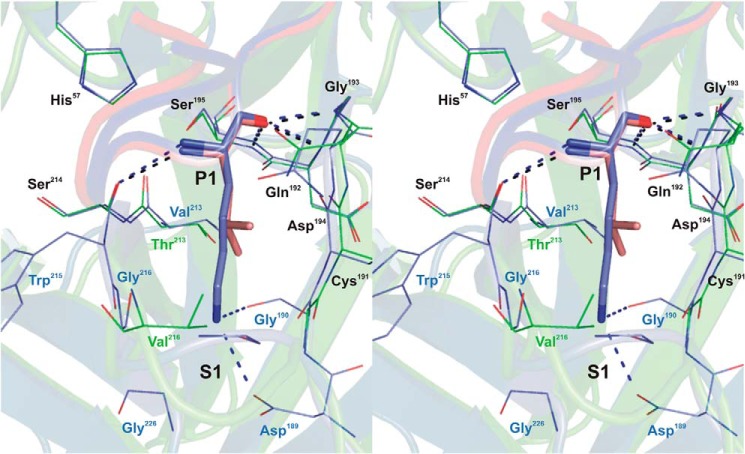
FIGURE 2.
Stereo view of the P1-S1 interaction at the rShPI-1/K13L·PPE complex interface compared with that in the trypsin complex of wild-type rShPI-1A (35). Enzyme residues involved in inhibitor contacts are shown as a line representation (PPE, green; trypsin, blue), and primary binding loop residues of rShPI-1/K13L (salmon) and wild-type rShPI-1A (blue) are displayed as sticks. Conserved residues are labeled in black, and non-conserved residues are in the same color as the corresponding enzyme. Hydrogen bonds are represented by black (PPE) and blue (trypsin) dashed lines. To simplify the figure, water molecules that are present in the trypsin complex (35) around the P1 position are not included. For details of the interactions in the rShPI-1/K13L·PPE complex, see Tables 3 and 4.

