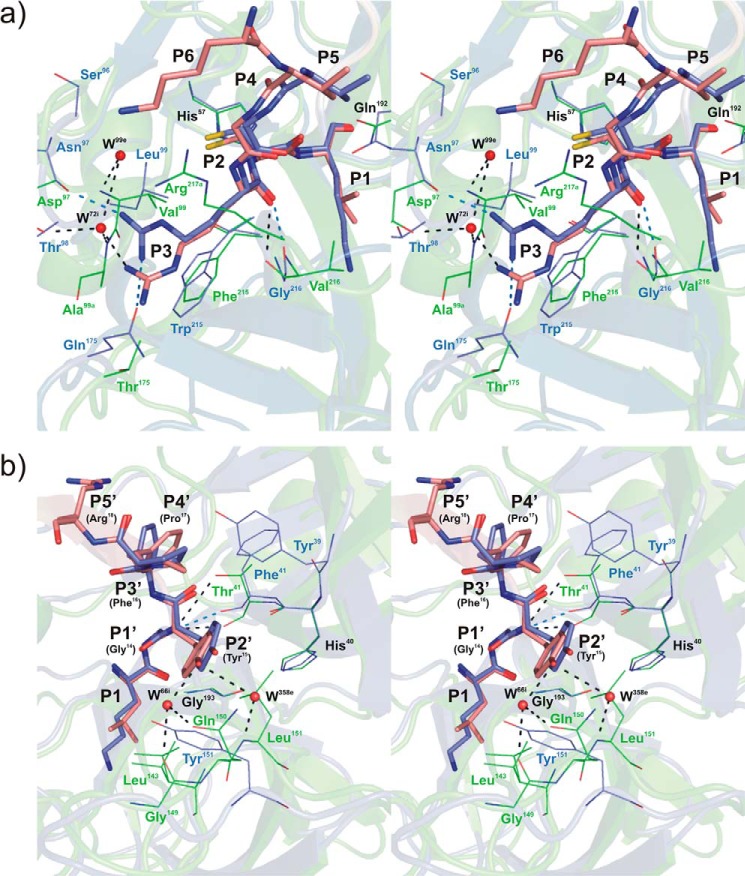
FIGURE 3.
Stereo view of the rShPI-1/K13L·PPE complex interface superposed with that of wild-type rShPI-1A in complex with trypsin (35) at the Pn (a) and Pn′ (b) site of the primary inhibitor binding loop. Enzyme residues involved in inhibitor contacts are shown in line representation (PPE, green; trypsin, blue; conserved residues His57 and Gln192, black labels), and primary binding loop residues of rShPI-1/K13L (salmon) and wild-type rShPI-1A (blue) are displayed as sticks. The side chain at the P1 position of the inhibitor is included to enable a comparison with Figs. 1c and 2. Hydrogen bonds are represented by black (PPE) and blue (trypsin) dashed lines. Water molecules (W) are shown as red spheres and are labeled according to the PDB files in which they are assigned to the enzyme (e) or inhibitor (i) chains. Conformational differences between both complexes are restricted to position P3 at the Pn site of the primary binding loop. The P6 residue is only involved in the interface within the rShPI-1/K13L·PPE complex. For details of the interactions in the rShPI-1/K13L·PPE complex, see Tables 3 and 4.

