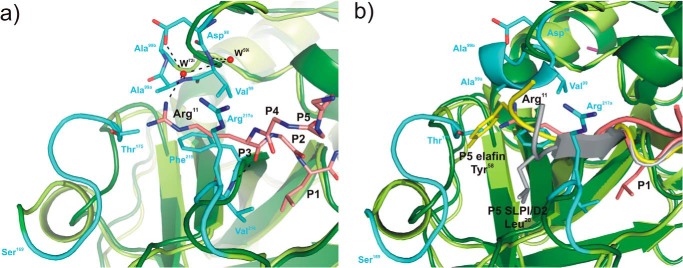
FIGURE 5.
Structural superposition of elastases in complex with BPTI-Kunitz- and WAP-type inhibitors focused on the non-prime subsite of the primary binding loops of the inhibitors. a, interface between PPE (dark green, schematic representation) and rShPI-1/K13L (salmon, stick representation) around the P3 residue (Arg11) at the Pn side of the primary binding loop (residues P6–P1). To highlight structural differences between elastases, the PPE structure is superposed with that of HNE (light green, PDB code 2Z7F), and PPE regions characterized by significant main chain deviations are highlighted in cyan. PPE residues interacting with the P3 residue of rShPI-1/K13L as well as the inhibitor side chains of Arg11 (P3) and Leu13 (P1) are shown in stick representation. Hydrogen bonds are represented with black dashed lines. Water molecules (W) are shown as red spheres and are labeled according to the PDB file in which they are assigned to the inhibitor (i) chain. b, corresponding interface region in the PPE (dark green) and HNE (light green) complexes of the WAP inhibitors elafin (gray, PDB code 1FLE) and SLPI/D2 (yellow, PDB code 2Z7F), respectively, shown in schematically. The side chains of residues at their P5 sites, Tyr58 in elafin and Leu20 in SLPI/D2 (12), are highlighted as sticks.

