
FIGURE 5.
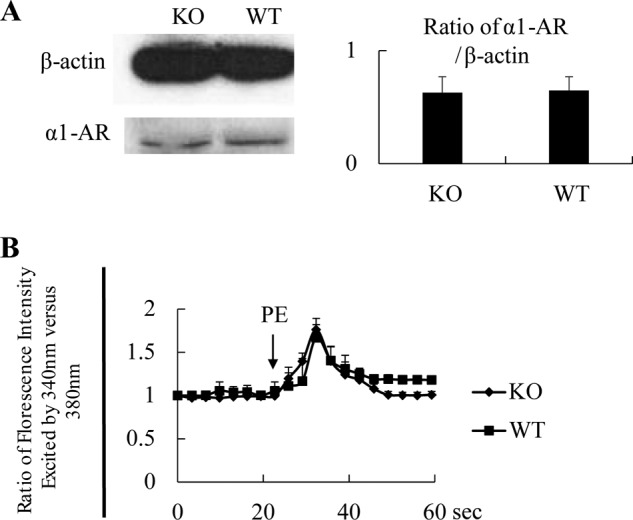
AR and Ca2+ flux in KO VSMCs. A, normal α1-AR expression in EPHB4 KO VSMCs according to immunoblotting. VSMCs from male Ephb4 KO and WT mice were cultured for 4 days and then harvested. Cell lysates were analyzed for α1-AR expression by immunoblotting. β-Actin levels were used as internal controls. A representative immunoblot is shown. Densitometry data from 2 independent experiments were pooled and presented as a bar graph on the right with means ± S.E. indicated. No statistically significant differences between KO and WT VSMCs were found according to Student's t test. B, normal Ca2+ flux in VSMCs from EPHB4 KO mice. VSMCs from male Ephb4 KO or WT mice were cultured for 4 days and loaded with Fura2. They were then placed in Hanks' balanced salt solution without Ca2+ at 37 °C and stimulated with PE (20 μm). The arrow indicates the time point at which PE was added. The ratio of emissions at 510 nm triggered by 340 nm versus 380 nm excitation in each cell was registered every 3 s for 1 min. The experiments were conducted 3 times. Means ± S.E. of the ratio of more than 15 randomly selected VSMCs in a representative experiment are illustrated. No statistically significant differences between the KO and WT groups were found according to Student's t test.