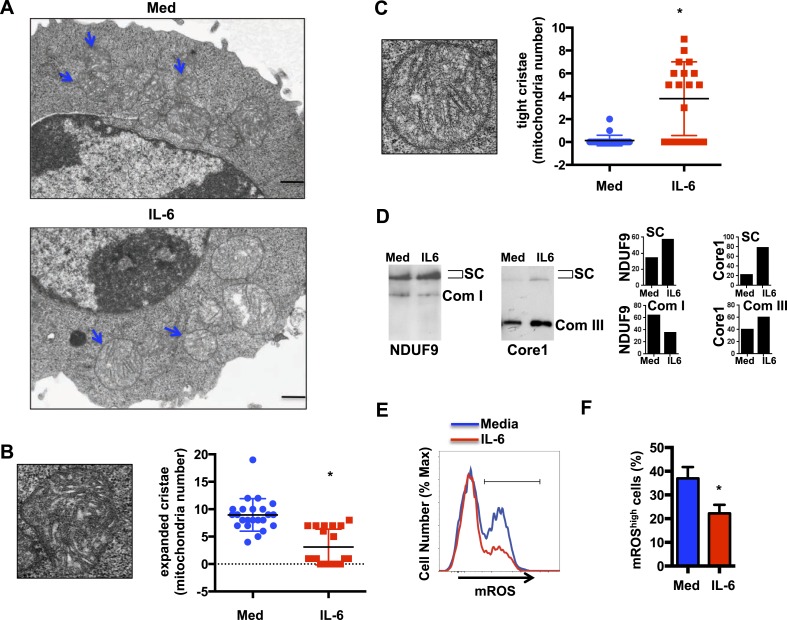
Figure 2. IL-6 facilitates the formation of respiratory chain supercomplexes in CD4 cells during activation.
(A) Transmission electron microscopy analysis of mitochondria in CD4 cells activated in the presence or absence of IL-6. Original magnification, 6,000×. Bars represent 500 nm; Blue arrows indicate mitochondria (B) Representative image of an ‘expanded cristae’ mitochondrion (Left). Number of mitochondria with expanded cristae in CD4 cells activated in the presence or absence of IL-6 (right). (n = 25). (C) Representative image of a ‘tight cristae’ mitochondrion (Left). Number of mitochondria with tight cristae in CD4 cells activated in the presence or absence of IL-6 (right). (n = 23). Error bars represent the mean ± SD. *denotes p < 0.05, as determined by Student's t test. Results are representative of 2 experiments. (D) Digitonin-soluble mitochondrial extracts from CD4 cells were resolved by BN-PAGE and transferred onto a membrane (Western blot) and immunoblotted for NDUFA9 and Core1 protein. Immunoreactivity for the two proteins within the supercomplex (SC) region is shown. Immunoreactivity for NDUFA9 with monomeric complex I (Com I) and Core1 with dimeric complex III (Com III) are shown. Lower panels display the densitometry of NDUFA9 (left) and Core I (right) subunits within the supercomplex region (SC) and densitometry at the individual Complex I (Com I) and Complex III (Com III) respectively. (E) Mitochondrial ROS during activation of CD4 cells with anti-CD3/28 Abs in the presence or absence of IL-6 for 48 hr was determined by staining with MitoSox and flow cytometry analysis. (F) Percentage of CD4 cells with mROShigh, defined by the gate displayed in (E) at 48 hr, after activation as in (E) (n = 4). Error bars represent the mean ± SD. *denotes p < 0.05, as determined by Student's t-test. Results are representative of 2 experiments.


