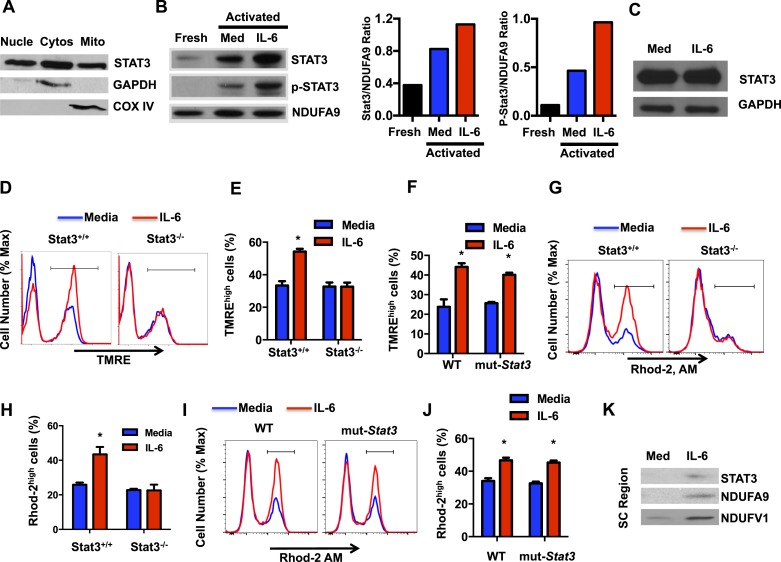
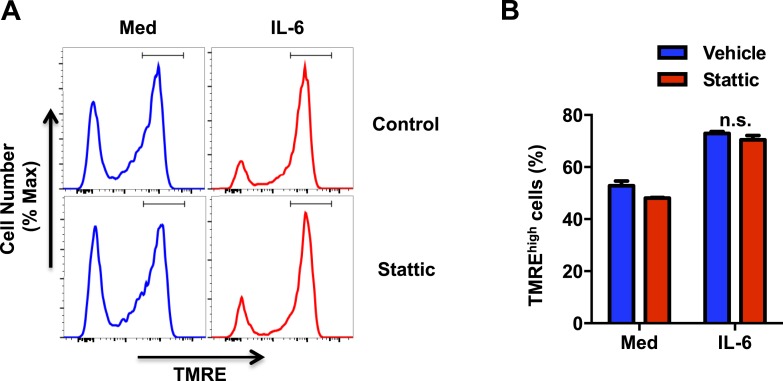
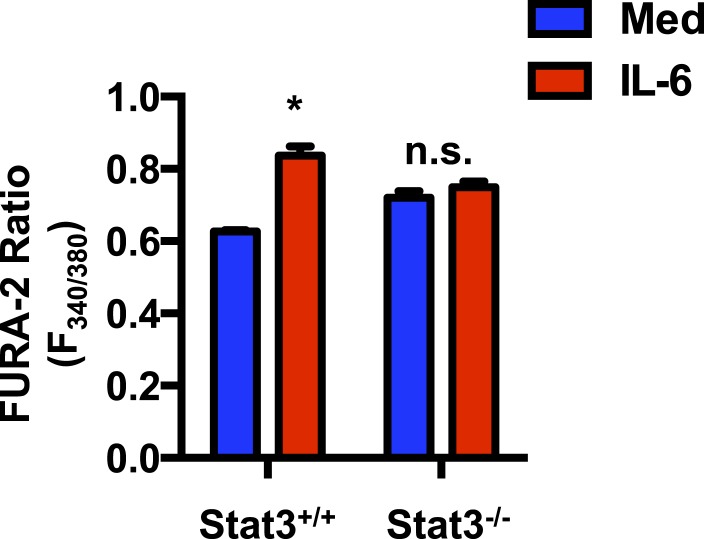
Figure 5. The regulation of the MMP and mitochondrial Ca2+ elicited by IL-6 is Stat3 dependent.
(A) CD4 cells were activated with anti-CD3 and anti-CD28 mAbs. After 48 hr, cytosolic, nuclear and mitochondrial fractions were prepared and used to examine Stat3 by Western blot analysis. GAPDH and COX IV were used as markers for cytosol and mitochondria, respectively. (B) Mitochondrial fractions from freshly isolated CD4 cells, and CD4 cells activated (48 hr) with (IL-6) or without IL-6 (Media) were analyzed for Stat3, phospho-Stat3 (p-Stat3) and the Complex I subunit NDUFA9, as mitochondrial loading control. Relative densitometry ratios of p-Stat3 to NDUFA9 and total Stat3 to NDUFA9 in cells activated in the presence and absence of IL-6 are shown. (C) Total Stat3 levels in CD4 cells activated (48 hr) with or without IL-6 were examined by Western blot analysis using whole cell extracts. GAPDH was used as loading control. (D) MMP in Stat3+/+ or Stat3−/− CD4 cells activated with anti-CD3/28 Abs in the presence or absence of IL-6 for 48 hr (n = 3). (E) Percentage of TMREhigh population in Stat3+/+ or Stat3−/− CD4 cells activated from (D) (n = 3). (F) Percentage of TMREhigh population in WT or mut-Stat3 CD4 cells activated from (n = 3). (G) Mitochondrial Ca2+ (Rhod-2 AM staining) in Stat3+/+ or Stat3−/− CD4 cells activated as in (D). (H) Percentage of Rhod-2high population (gate shown in panel G) in Stat3+/+ or Stat3−/− CD4 cells (n = 3). (I) Mitochondrial Ca2+ (Rhod-2 AM staining) in WT or mut-Stat3 CD4 cells activated as in (D). (J) Percentage of Rhod-2high population (gate shown in panel I) in WT or mut-Stat3 CD4 cells activated as in (D) (n = 3). (K) Mitochondrial fractions of CD4 cells activated (48 hr) with or without IL-6 were resolved by BN-PAGE. Supercomplexes regions (SC region) of BN-PAGE were excised and analyzed for Stat3, NDUFA9 and NDUFV1 by Western blot analysis. Error bars represent the mean ± SD. *denotes p < 0.05, as determined by Student's t test and one-way or two-way ANOVA test. Results are representative of 2–3 experiments.


