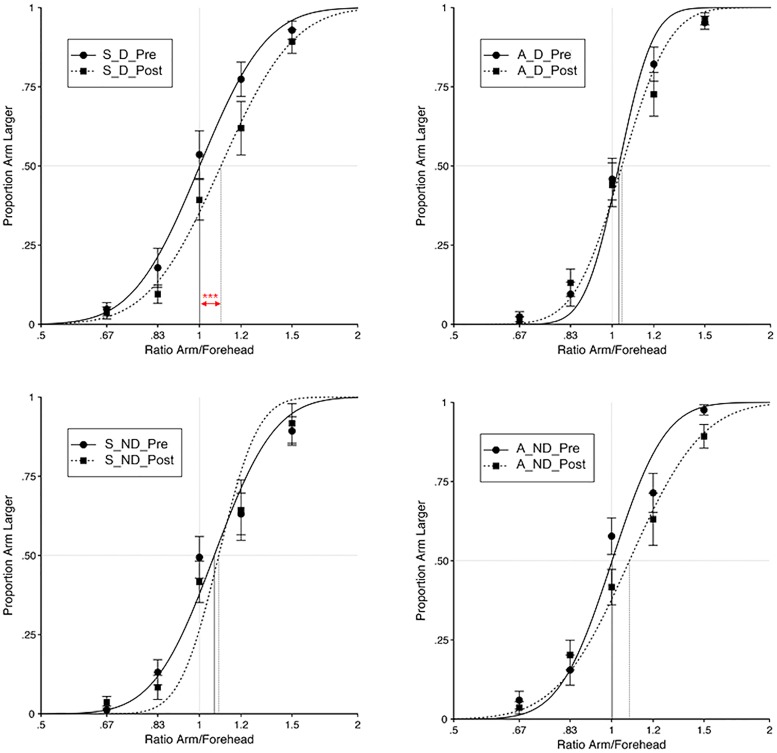
FIGURE 3.
Results from Experiment 2. For each experimental condition (S–D, Synchronous – Displacement; S–ND, Synchronous – No Displacement; A–D, Asynchronous – Displacement; A–ND, Asynchronous – No Displacement), and for both the Pre- and Post-test, the proportion of judgements that the distance between dual tactile stimuli on the right arm felt greater than on the forehead was analyzed as a function of the ratio of the length of the arm and forehead stimuli (i.e., 4/6, 5/6, 1, 6/5, or 6/4). Curves are cumulative Gaussian function fits to the group data, for each condition, with least-squared regression. Error bars indicate the SEM. Vertical lines indicate the interpolated PSE between the perceived distance on the arm and on the forehead. Red asterisks denote a significant change in PSE from Pre- to Post-test (∗∗∗denotes p < 0.001, corrected for multiple comparisons). Note that an increase in the PSE meant that perceived tactile distances on the arm were felt smaller, as compared to distances on a reference location.

