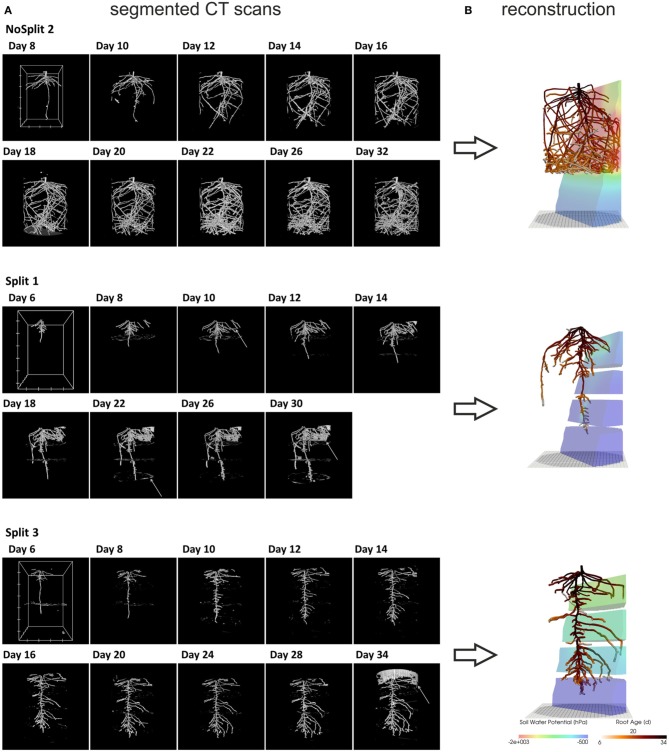
Figure 2.
(A) Three dimensional rendered view of the segmented CT images at different scan times. White arrows indicate misclassified objects: NoSplit 2, Day 8: plastic bead Split 1, Day 10: tensiometer, Day 22: paraffin layer, Day 30 soil crack. Split 3, Day 34: container wall. White boxes at Day 8 or 6 show the scaling of the root system: the distance between two ticks equals 100 pixels, which equals 2.45 cm for NoSplit2 and 2.77 cm for the Split setups. (B) VR reconstructions of root system architectures at the end of each experiment within their respective soil Root systems are colored according to root age and the soil according to the simulated soil water potential.

