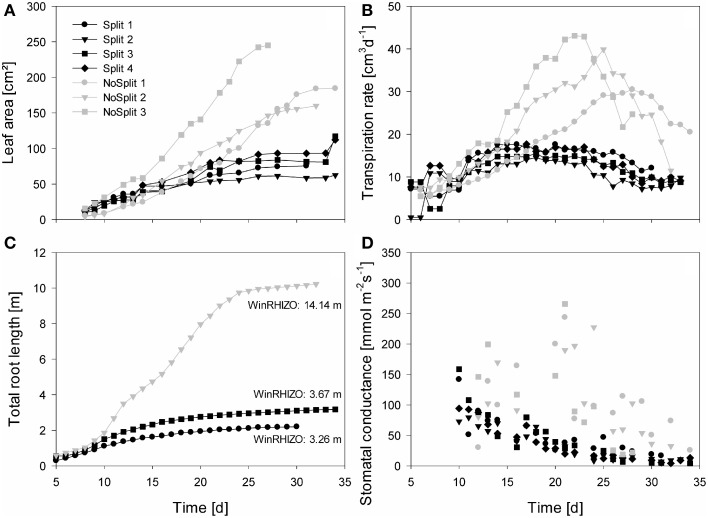
Figure 4.
Measured plant traits over time from Day 5/10 until Day 35. Gray symbols represent the NoSplit setup and black symbols the Split setup. Different symbols represent replications. (A) One-sided leaf area, (B) Transpiration rate, (C) total estimated root length of the samples used for modeling, (D) stomatal conductance of the youngest unfolded leaves, data points represent the mean of two measurements.

