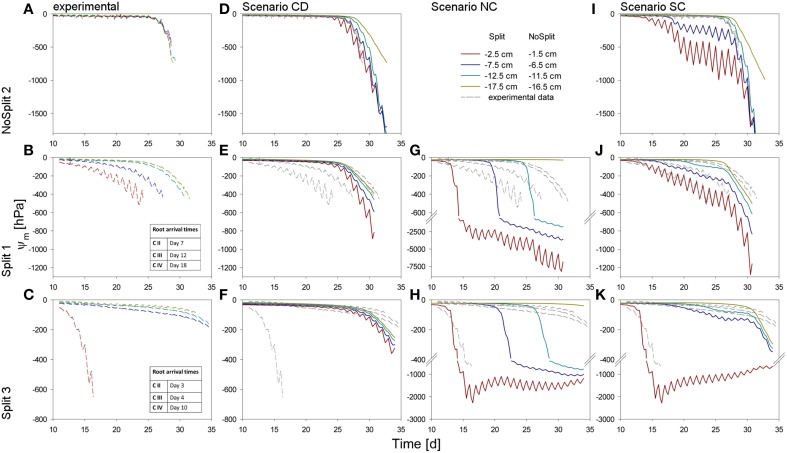
Figure 5.
Soil matric potentials for the three samples (top to bottom) within the different compartments. (A–C) Values measured by the tensiometers in the experiments. (D–K) Comparison of different scenarios with the measured values, repeated in dashed, gray lines. (D–F) Simulation CD – unrestricted, continuous soil domain, (G,H) Simulation NC – impermeable, non-conductive layers, (I–K) Simulation SC – semi-conductive layers.

