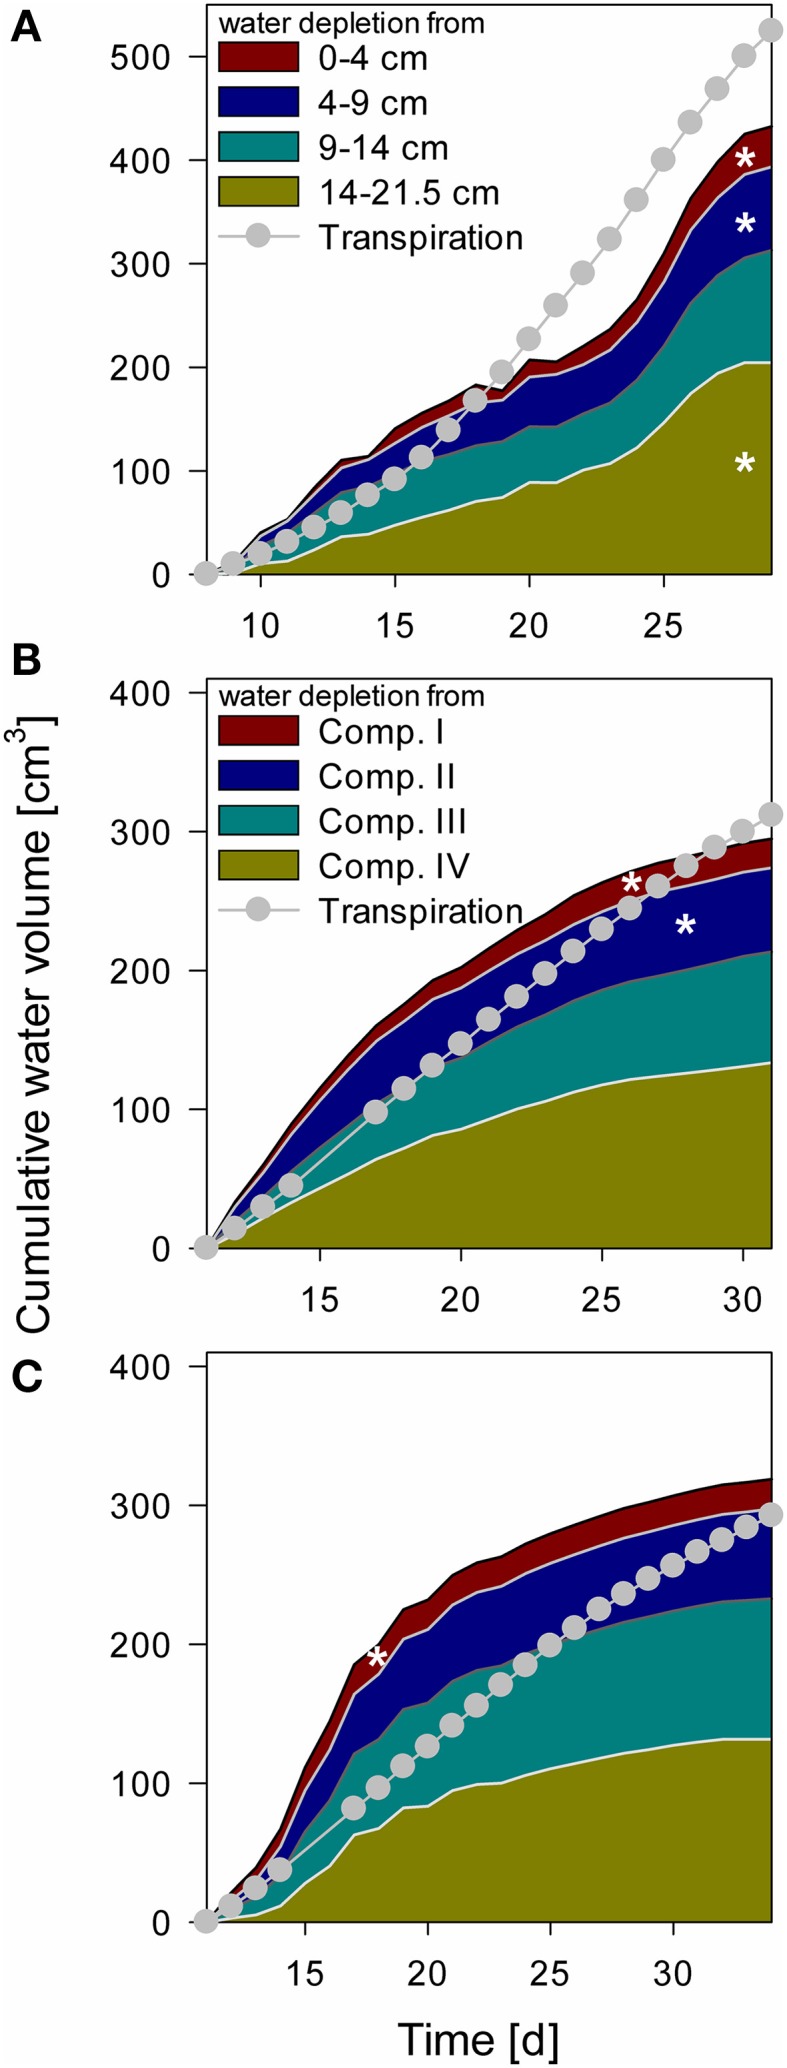
Figure 6.

Cumulative water depletion from each compartment over time compared to cumulative transpiration from Day 8 for NoSplit (A) and Day 11 for Split 1 (B) and Split 3 (C) until the end of the experiment. Filled areas represent cumulative water content change in the different compartments calculated from tensiometer measurements. Gray line and circles represent cumulative transpiration measured with balances. White asterisks denote the point, when the tensiometer in the compartment showed air bubbles.
