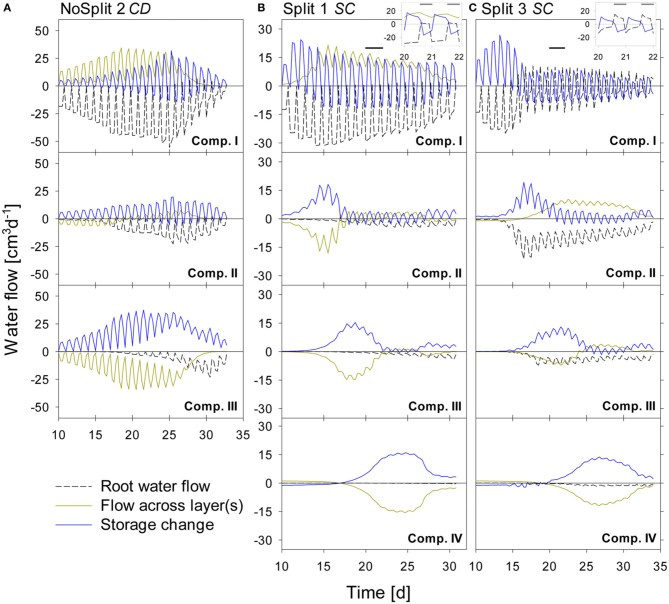
Figure 7.
Modeled water flow dynamics over time in the (A) NoSplit CD, (B) Split1 SC, and (C) Split 3 SC scenarios. Dashed black lines represent root water flow. Dark yellow lines represent the net flow across the paraffin layers from neighboring compartments. Negative values indicate water removal, positive values water addition to a compartment, respectively. Blue lines represent the resulting change of soil water content in the compartment with positive values denoting a decrease in water storage and negative values and increase in storage. Plotted values are flow rates at four discrete times per day. Because there is only one value for the night phase, flows at night appear as single peaks. The inlays at the top show the dynamics in Compartment I between Days 20–22 (as indicated by the black bars) at a higher temporal resolution (10/d), showing the dynamics of RWU and hydraulic redistribution.

