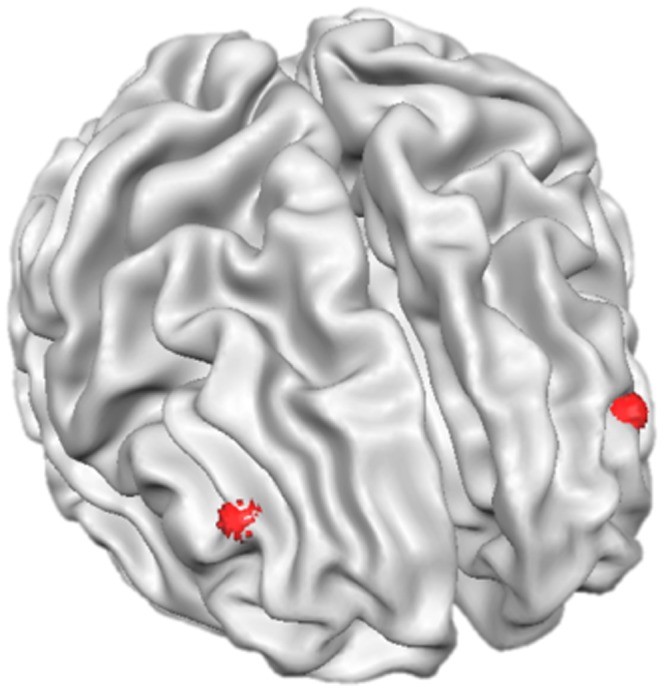
Fig. 1.

Target area for the magnetic brain stimulation. Each target was selected based on the individual anatomical image obtained in a separate MRI measurement. The red dots represent the two target points in Talairach space: x = ±39, y = 37, z = 22.
