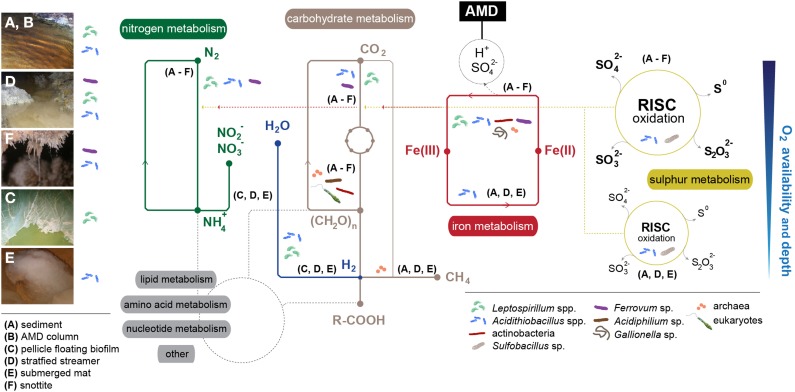
Figure 3.
Overview of the metabolic networks that govern adaptation to extreme conditions in AMD microbial communities by micro-environment (A–F). Main implicated taxa/groups are displayed. Dashed red-yellow lines represent chemical energy fueling carbon and nitrogen fixation. Dashed-gray lines display connections with lipid, amino acid, nucleotide and other metabolisms. Oxygen availability and depth refers only to nitrogen, carbohydrate, iron, and sulfur metabolisms. Main bacterial groups present in each environment have been included for a more intuitive understanding of the relationship between taxa and their spatial distribution.

