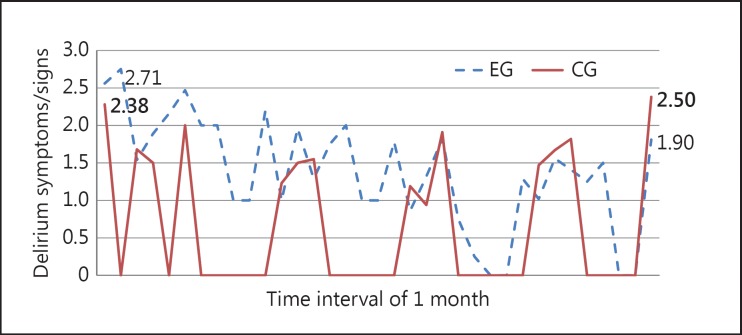
Fig. 2.
Number and evolution of CAM scores among the participants of the EG and the CG during the study period. Average of delirium symptoms/signs during the study period in the EG (n = 51) and CG (n = 52). 798 delirium assessments in the EG (244 assessments during the interventions, 452 delirium assessments during usual care, 51 delirium assessments during M1, and 51 delirium assessments during M2); 588 delirium assessments in the CG (484 assessments during usual care, 52 assessments during M1, and 52 delirium assessments during M2).

