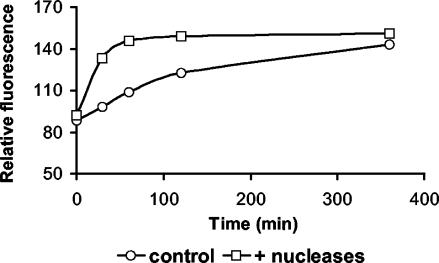
FIG. 3.
Time course analysis of poly(dɛA) degradation in treated (i.e., with added nucleases) and control (i.e., non-enzymatically treated) sediment samples. Data, expressed in relative fluorescence units, refer to time course experiments carried out with the top 1 cm of sediments collected outside Ancona Harbor.

