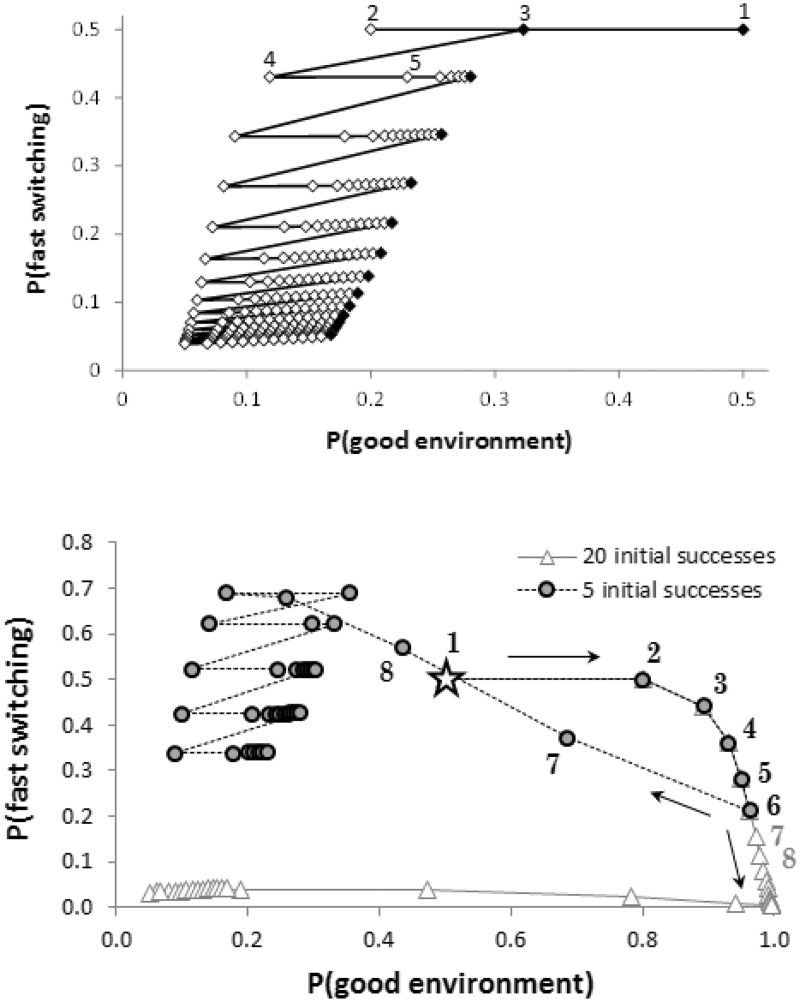
Figure 2.
(a) Effect of a sequence of failures on the two probabilities P(Eg) and P(αf) for an individual following the optimal strategy, where the outcome of trying is fixed as a failure. Black markers indicate trying whereas white markers indicate resting. The values on each axis are each a sum of probabilities; at each data point, P(Eg) = P(Eg, αf) P(Eg, αs) and P(αf) = P(Eg, αf) + P(Eb, αf). (b) The effect of a sequence of failures depends strongly on how many successes were previously experienced. The figure shows two sets of trajectories, each for 40 time steps, each starting at P(Eg) = 0.5, P(αf) = 0.5 (indicated by the star symbol). The solid grey line (triangle markers) corresponds to 20 successes followed by 20 failures. The dashed black line (circle markers) shows five successes (following the exact same path for those time steps) followed by 35 failures. Following 20 successes, it only takes a few failures for the individual to decide to rest for a prolonged period (appearing ‘depressed’ by Characterization 2), because it is relatively sure that current conditions are bad and that the switching rate is slow. However, if the environment has just switched from bad to good, the resultant behaviour would be regarded as depressed under Characterization 3 and, with one unlucky outcome, even Characterization 4, as the individual would then be choosing to rest despite being in the good environment

