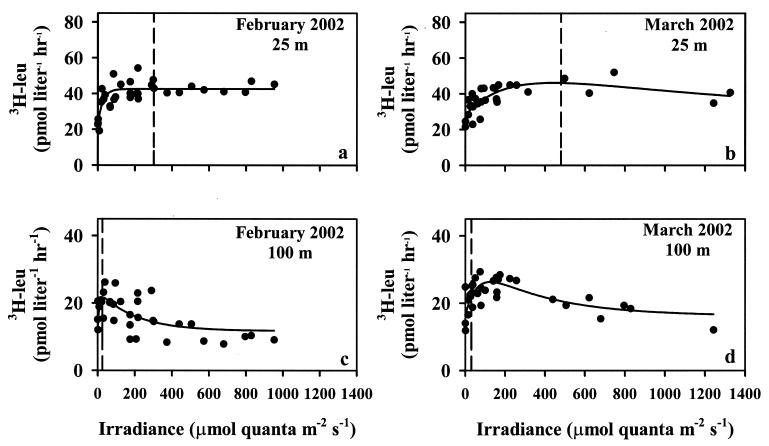
FIG. 2.
Relationships between [3H]leucine incorporation and irradiance in the upper photic zone (panels a and b) and deep photic zone (panels c and d) at Station ALOHA. Fitted lines are least-squares nonlinear regressions (see the text); parameters defining the lines are given in Table 2. Dashed vertical lines represent maximal (local noon) photosynthetically available radiation flux measured at each depth for the cruises shown.

