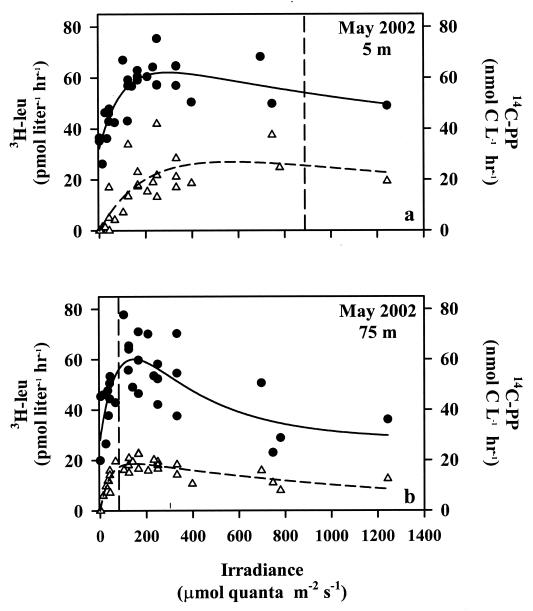
FIG. 3.
Responses of [3H]leucine incorporation (solid circles) and 14C-labeled photoautotrophy products (open triangles) to irradiance in the upper (a) and deep (b) photic zones. Experiments conducted in May 2002. Fitted lines are least-squares nonlinear regression (see the text), and parameters defining the lines are given in Tables 2 and 3. Dashed vertical lines represent the maximal (noon) photosynthetically available radiation flux measured at each depth.

