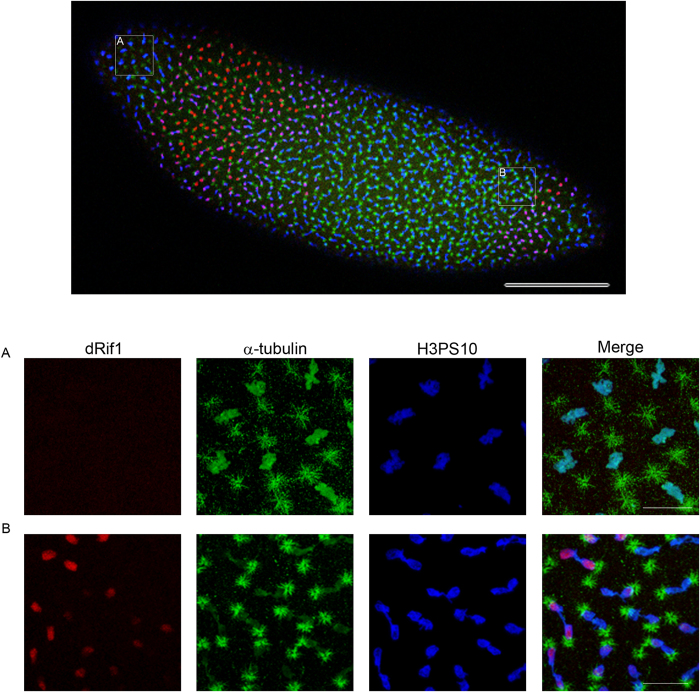
Figure 3. dRif1 localization across cell cycle.
A single embryo with nuclei in various stages of mitosis stained with dRif1 antibody (red) along with mitotic marker-H3PS10 (blue) and tubulin (green). Higher magnification images (A and B) are from marked regions of the same embryo showing dynamic association of dRif1 on separated anaphase chromosomes. The scale bar represents 100 μm in the lower magnification image and 20 μm in the higher magnification insets.

