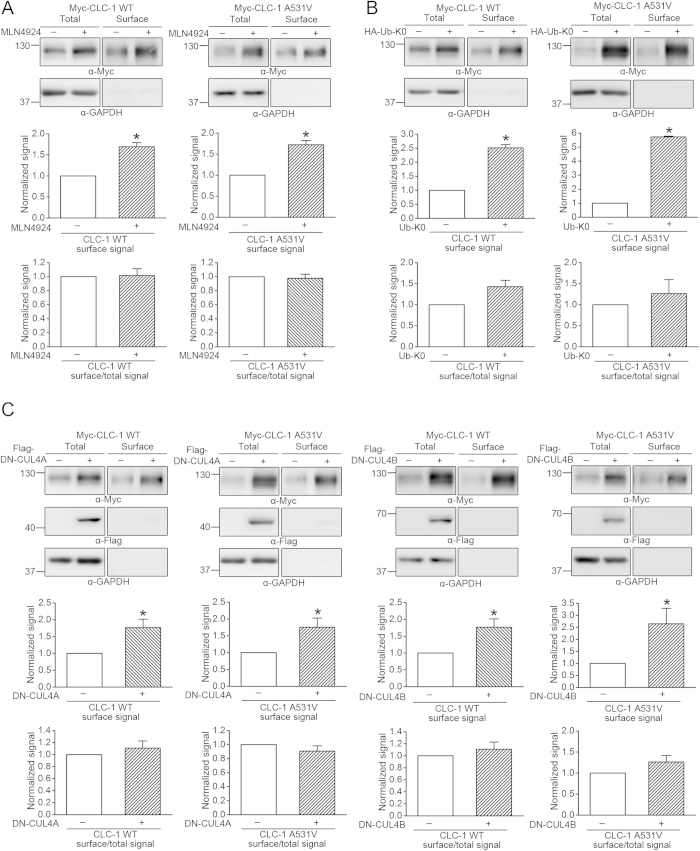
Figure 5. Suppression of CUL4A/B E3 ligase activity increases CLC-1 surface expression.
Surface biotinylation experiments on HEK293T cells expressing Myc-CLC-1 channels in the presence of (A) 10 μM MLN4924, (B) HA-Ub-K0, or (C) Flag-DN-CUL4A/B. Drug-free incubation or co-expression with the HA/Flag vector was used as the control experiment. (Top) Representative immunoblots. Cell lysates from biotinylated intact cells were either directly employed for immunoblotting analyses (total) or subject to streptavidin pull-down before being used for immunoblotting analyses (surface). (Middle) Quantification of surface protein level. The surface protein density was standardized as the ratio of surface signal to cognate total actin signal, followed by normalization to that of the corresponding control. Asterisks denote significant difference from the control (*, t-test: p < 0.05; n = 3-9). (Bottom) Quantification of surface expression efficiency. The total protein density was standardized as the ratio of input signal to actin signal. The efficiency of surface presentation was expressed as surface protein density divided by the corresponding standardized total protein density. The mean surface expression ratio was normalized to that of the corresponding control. The gels were run under the same experimental conditions. Uncropped images of immunoblots are shown in Supplementary Figure S2.

